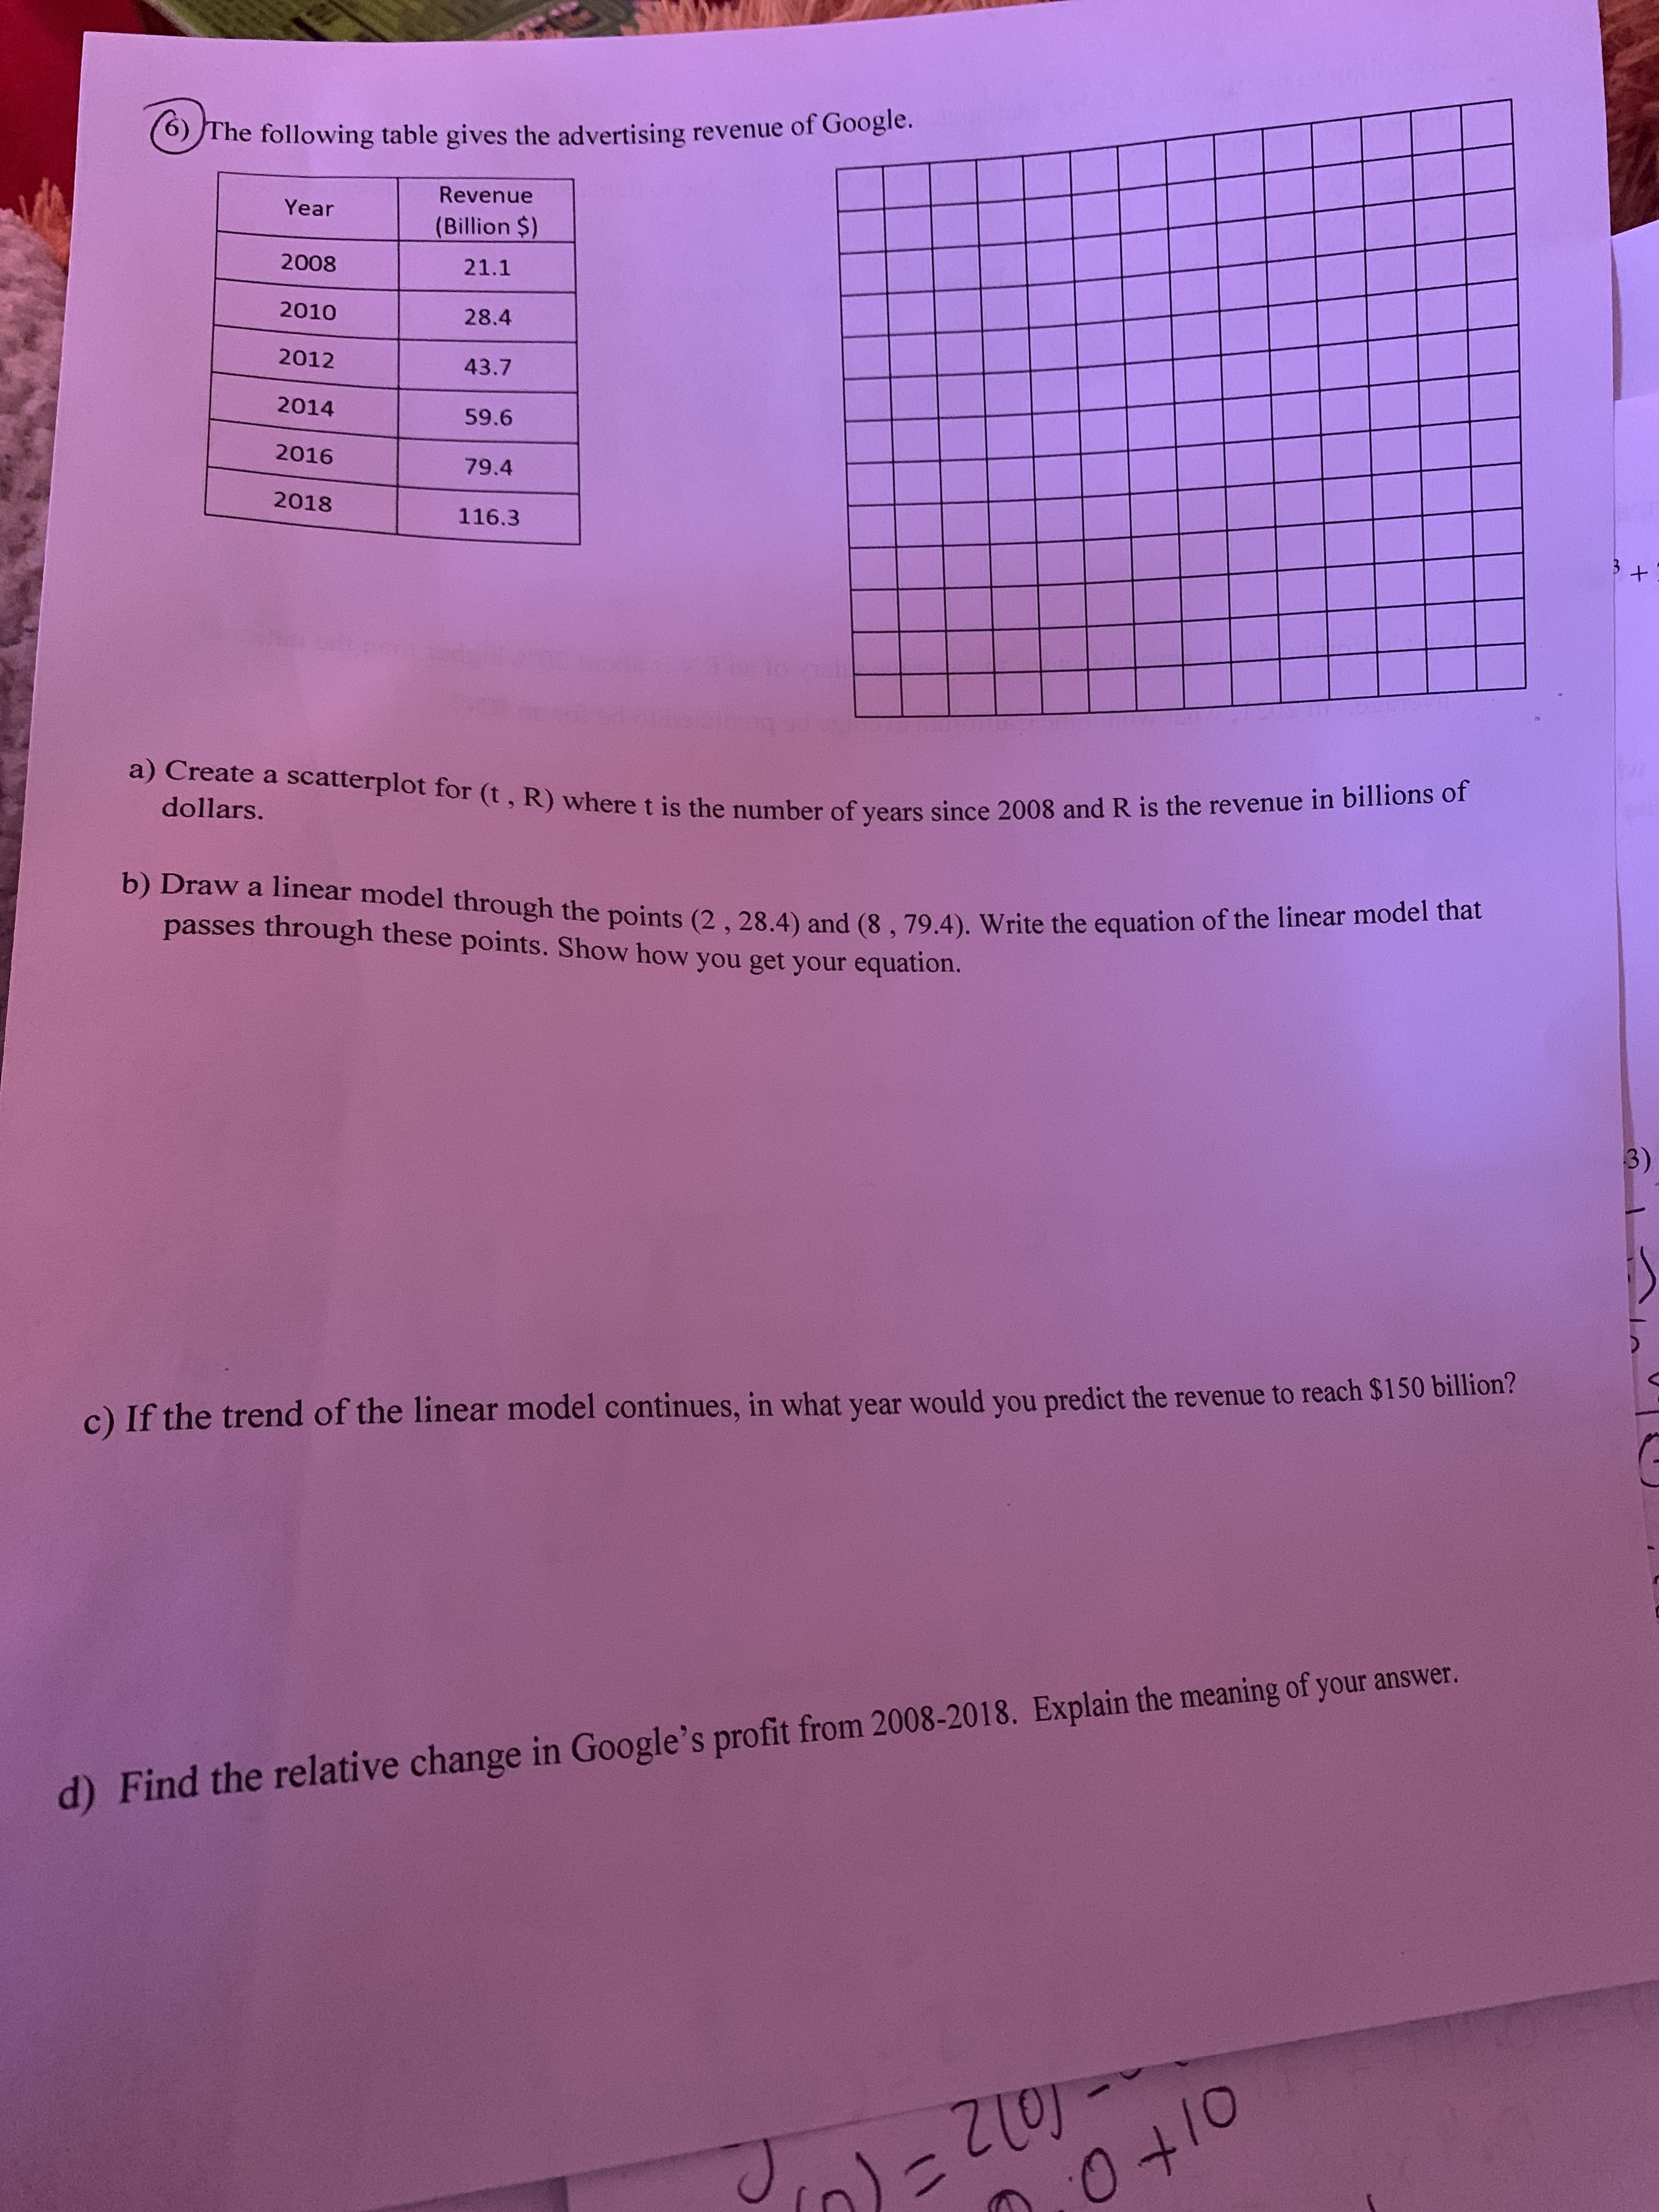
OThe following table gives the advertising revenue of Google. Revenue Year (Billion $) 2008 21.1 2010 28.4 2012 43.7 2014 59.6 2016 79.4 2018 116.3 a) Create a scatterplot for (t, R) where t is the number of years since 2008 and R is the revenue in billions of dollars. b) Draw a linear model through the points (2, 28.4) and (8, 79.4). Write the equation of the linear model that passes through these points. Show how you get your equation. 3) c) If the trend of the linear model continues, in what year would you predict the revenue to reach $150 billion? d) Find the relative change in Google's profit from 2008-2018. Explain the meaning of your answer. 1072 0+10 Jin)=
OThe following table gives the advertising revenue of Google. Revenue Year (Billion $) 2008 21.1 2010 28.4 2012 43.7 2014 59.6 2016 79.4 2018 116.3 a) Create a scatterplot for (t, R) where t is the number of years since 2008 and R is the revenue in billions of dollars. b) Draw a linear model through the points (2, 28.4) and (8, 79.4). Write the equation of the linear model that passes through these points. Show how you get your equation. 3) c) If the trend of the linear model continues, in what year would you predict the revenue to reach $150 billion? d) Find the relative change in Google's profit from 2008-2018. Explain the meaning of your answer. 1072 0+10 Jin)=

Elementary Linear Algebra (MindTap Course List)
8th Edition
ISBN:9781305658004
Author:Ron Larson
Publisher:Ron Larson
Chapter2: Matrices
Section2.CR: Review Exercises
Problem 90CR

Related questions

Topic Video
Question
Answer a, b,c
Transcribed Image Text:OThe following table gives the advertising revenue of Google.
Revenue
Year
(Billion $)
2008
21.1
2010
28.4
2012
43.7
2014
59.6
2016
79.4
2018
116.3
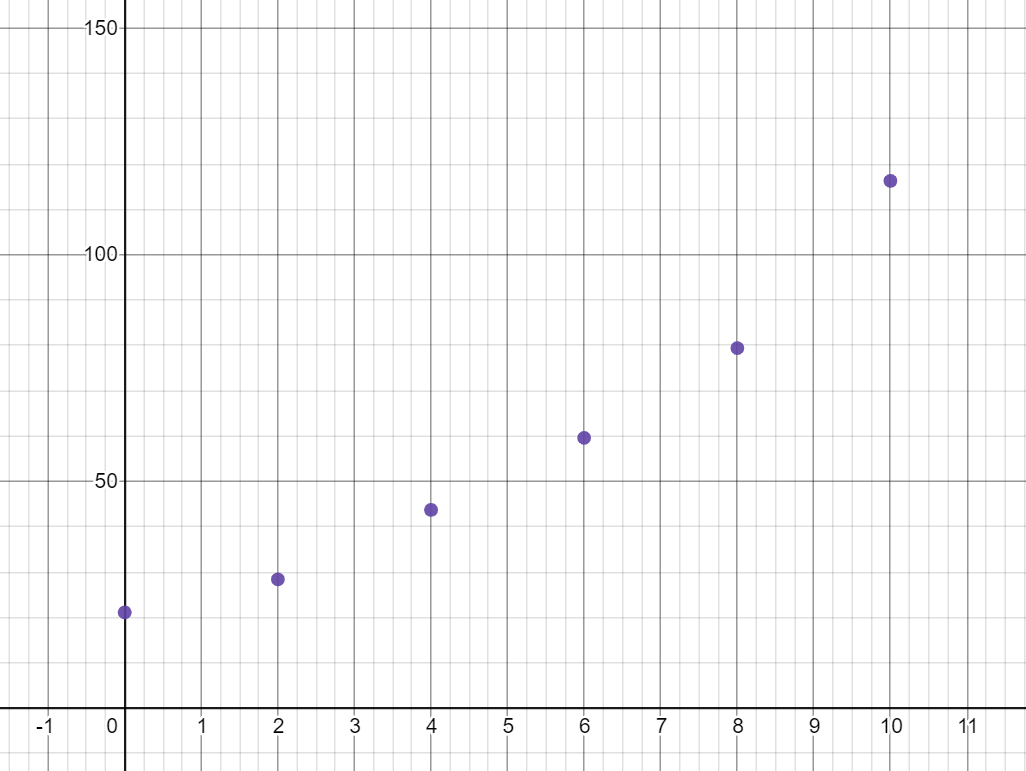
a) Create a scatterplot for (t, R) where t is the number of years since 2008 and R is the revenue in billions of
dollars.
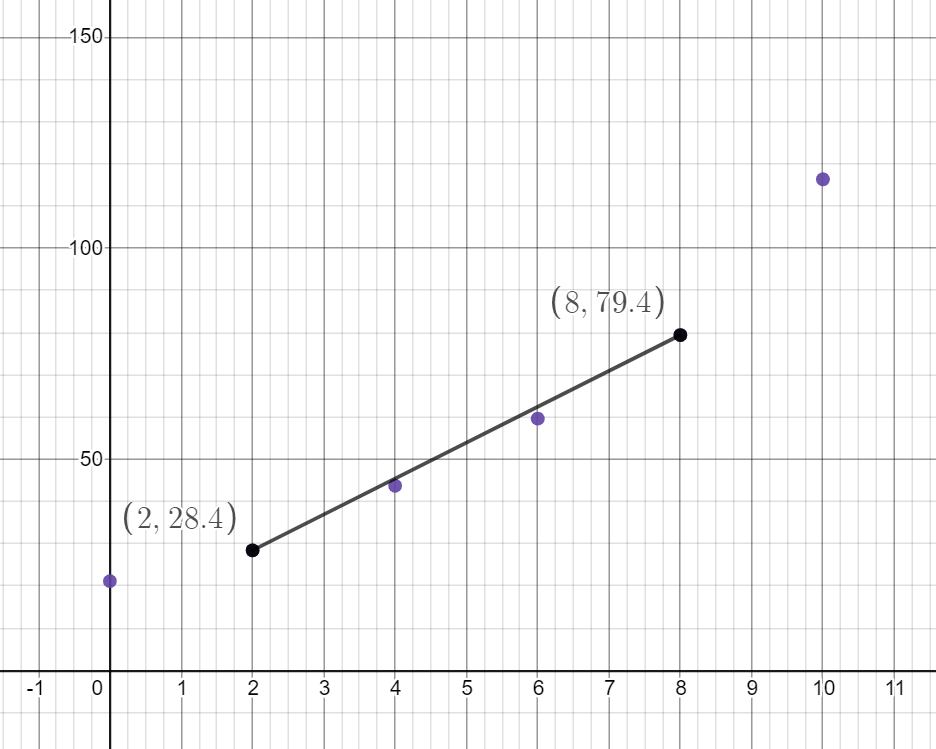
b) Draw a linear model through the points (2, 28.4) and (8, 79.4). Write the equation of the linear model that
passes through these points. Show how you get your equation.
3)
c) If the trend of the linear model continues, in what year would you predict the revenue to reach $150 billion?
d) Find the relative change in Google's profit from 2008-2018. Explain the meaning of your answer.
1072
0+10
Jin)=
Expert Solution
Step 1
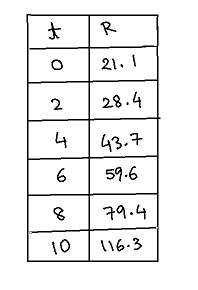
We subtract 2008 from the years to get the t values. And the R values are same as the given values
Step 2
We graph them using a graphing calculator.
Step 3
b) We graph the line joining (2,28.4) and (8,79.4)

Step by step
Solved in 6 steps with 6 images

Knowledge Booster


Learn more about
Need a deep-dive on the concept behind this application? Look no further. Learn more about this topic, algebra and related others by exploring similar questions and additional content below.Recommended textbooks for you
Elementary Linear Algebra (MindTap Course List)
Algebra
ISBN:
9781305658004
Author:
Ron Larson
Publisher:
Cengage Learning

Linear Algebra: A Modern Introduction
Algebra
ISBN:
9781285463247
Author:
David Poole
Publisher:
Cengage Learning

Functions and Change: A Modeling Approach to Coll…
Algebra
ISBN:
9781337111348
Author:
Bruce Crauder, Benny Evans, Alan Noell
Publisher:
Cengage Learning
Elementary Linear Algebra (MindTap Course List)
Algebra
ISBN:
9781305658004
Author:
Ron Larson
Publisher:
Cengage Learning
Linear Algebra: A Modern Introduction
Algebra
ISBN:
9781285463247
Author:
David Poole
Publisher:
Cengage Learning
Functions and Change: A Modeling Approach to Coll…
Algebra
ISBN:
9781337111348
Author:
Bruce Crauder, Benny Evans, Alan Noell
Publisher:
Cengage Learning

College Algebra
Algebra
ISBN:
9781305115545
Author:
James Stewart, Lothar Redlin, Saleem Watson
Publisher:
Cengage Learning

Algebra & Trigonometry with Analytic Geometry
Algebra
ISBN:
9781133382119
Author:
Swokowski
Publisher:
Cengage

Big Ideas Math A Bridge To Success Algebra 1: Stu…
Algebra
ISBN:
9781680331141
Author:
HOUGHTON MIFFLIN HARCOURT
Publisher:
Houghton Mifflin Harcourt