

Q: In Problem,is the graph shown the graph of a function?
A:
Q: Explain how the graph of g is obtained from the graph of f. x-5 %D
A:
Q: What happened to the graph? f(x) = -Ix| Flx) f(x)
A: Given problem:- Graph the function f(x)=-|x|
Q: Of Oh Oi
A:
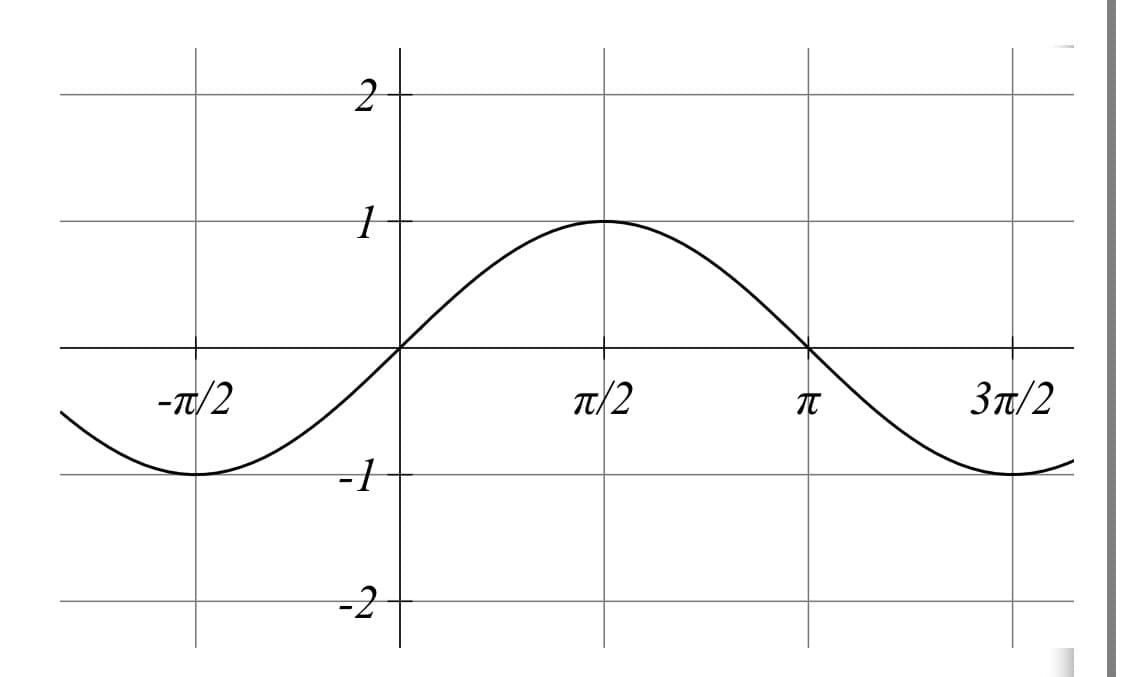
Q: The graph below resembles the graph of which of the following functions?
A: As you can see, this is perfectly a sine graph as it goes upward after x = 0+ and negative when x =…
Q: What happened to the graph? f(x) = -0.5|x| Fix) f(x)
A:
Q: Which of the following graphs could represent a graph of a function? Select all that apply.
A: Given that: graphs of equations as shown.
Q: The graph shows the function f(x) = x° in blue and another function g(x) in red. Which of the…
A: Transformation of f(x) to g(x)is obtained by1 units horizontal shift to the right.horizontal shift…
Q: Based on the graph what is the value of f (4)
A: Solution: The objective is to find the value of f(4) from the given graph
Q: D. Describe how to obtain the graph of g and h if g(x) = 2(x + 2)² – 3, h(x) = 2x² , and h(x) = 2(x…
A: Given: Let g(x)=2x+22-3 and h(x)=2x-32+2 from the function fx=2x2. Properties of the transformation…
Q: Choose the correct graph by clicking on it. X + 3 f(x) = x2 - 9
A: Question is solved.
Q: Which of the following graphs is the graph of f(x) = 3(.5)* -
A: The graph of f(x) is given below.
Q: Iff'(x) > 0 and f"(x) < 0, then which one is a possible graph of f(x)? Select one: O b.
A: SINCE f'(x)>0 so the function is an increasing function . so option truw for this particular…
Q: 10. Is the following graph the graph of a function?
A:
Q: Which of the following graphs is not a function? A. -5 С. ty k. -5 D.
A:
Q: Describe the end behavier of the graph of each function. 2.
A: The first graph is, From the above graph, it can be concluded that ends of the graph rises to the…
Q: For the function g whose graph is given, state the following. To type oo or -0o, enter INFINITY or…
A: According to company policy we are allowed to provide solution for only first 3 sub parts. If you…
Q: What graph models the function f(x) = 4(2)x? just show what the graph would look like.
A: We have to draw the graph models the function f(x) = 4(2)x And graph is looks like a curve which is…
Q: s. Is the following the graph of a function? Why or why not?
A: Clearly the given function has two different y-values for each x-value. Because any vertical line…
Q: Use the graph of f'(x) to identify the graph off (x). 6
A: Given graph f'(x) The graph is of the function is of the form f'(x)=4x+122-2.5 To find f(x)
Q: let f (x) =ex-1+3 which is the graph of x?
A:
Q: Which graph represènts the function g(x) = |x+ 4| + 2? 4- 4- 3- 3 2- 1- 4- 54 -3 -2 -1, 2 S4 -3 -2…
A:
Q: с. 2 -3m2 -T/2 TT/2 3m2 -1-
A: Amplitude is the vertical distance between the midline and one of the maximum or minimum points. We…
Q: The graph is a function. O True
A: in the question it is asked to show whether the given graph is a function or not.
Q: If f(4) = 10 then the point (4, ) is on the graph of f.
A: To find: If f(4) = 10 then the point (4, _____) is on the graph of f.
Q: Use the graph to answer the questions. y 51 5 4 3 2 -10 1 2 3 4 5 -2 4+ -5+ What is the dornain of…
A: Domain of the function is said to be set of real input values for which the function is always…
Q: 5. If Amber decides to mail copies of her photo to the 45 residents of her grandmother's assisted…
A: Given: The new function representation of her photo share is fx=34x+45 To determine: How does the…
Q: if f(x)= x2-3x-2 which graph could represent f(x)?
A: The given function is fx=x2-3x-2. Draw the graph of the given function. Here we use quadratic…
Q: Use the following graph and a translation or reflection to find the graph of the function. y = -f(x…
A:
Q: The graph of f'(x) is shown. Which graph would best represent the graph of f(x) ?
A:
Q: On the attached graph, indicate the position of f'(1).
A: The slope of the graph decreases the derivative graph also decreases. Similarly, as the slope of the…
Q: Sketch the graph then identify the domain and the range 4. f(x) %3%6(응x + 품) + 12
A:
Q: Is the following graph the graph of a function? If it is, is thefunction one-to-one?
A: Vertical line test If a vertical line is moved across the graph and, at any time, touches the graph…
Q: IS THIS GRAPH A FUNCTION AND IS IT A ONE TO ONE?
A:
Q: Use the graph to find the following. f(-2) = %! What is the domain?
A: Given data: The given graph. The value of f(-2) from the given graph is, f(-2)=-4 Thus, the value…
Q: Which of the following graphs represents a function that includes the values of x and y given in the…
A:
Q: From the graph of the function, state the intervals on which the function is increasing, decreasing,…
A: From the graph we have to find the intervals where the function is increasing or decreasing or…
Q: For the function g whose graph is given, state the value of each quantity, if it exists. (If an…
A:
Q: Select all of the following graphs which represent y as a function of x. -5 4 -3 -
A: we have find a graph that represents the y as a function of x
Q: The graph of the function +1, if 0 <r<5 f(r) = 3V5VT 51 if 5 <r< 10 4 is given in the figure below.
A: Since you have posted a question with multiple sub-parts, we will solve the first three subparts for…
Q: Given the function: y = -r + 3 and it's graph below, type in the number corresponding the answer for…
A: Given function y=-12x+3
Q: Graph the function f(x): - x + 4 Make sure to place a "Dot" on the graph for any Holes. 10+
A: The given function is fx=x-3x+4. To draw the graph of the function.
Q: نقطتان )2] For the graph, determine where .5 * .the function is discontinuous
A:
Q: Graph the following function using the vertex and axis of symmetry. f(x) = - (x + 8)2
A: Given, f(x)=-(x+8)2 at x=-8, f(x)=0 at x=-7, f(x)=-1 at x=0, f(x)=-64 The equation is of parabola…
Q: Given f as graphed, which could be the graph of f? (A) (C) (B) (D)
A: Given, from the graph In 0 to 1 , f'>0 at 1,…
Q: The graph of f", is given. y 2 -1 3 4 5 -2 -6 -8 -10 2.
A: Given: The graph of f''x is For x<2, f''x<0; For x=2, f''x=0; For x>2, f''x<0 As…
Q: Which of these graphs depicts when the blue function is less than the red function for the interval…
A:
Q: On the graph shown, what is f(2)? -2-
A: In this question , we can find the value of f(2). So look at the graph and check at x=2, what f(x)…
Q: х — 2 if x 2
A:
The graph is a graph of what function?

Step by step
Solved in 2 steps with 2 images


