Part 1 ot college professor believes that students achieve a higher grade point average (GPA) in the fall emester than in the spring semester. To test her theory, she samples 32 of her fall semester tudents and 46 of her spring semester students. The fall semester students had an average semester GPA of 3.44 with a standard deviation of 0.3; the spring semester students had an average semester GPA of 3.28 with a standard deviation of 0.35. If the GPAS in both student populations are- normally distributed, conduct a hypothesis test using a 4% level of significance to test the professor's theory. Step 1: State the null and alternative hypotheses. Let µf indicate the mean GPA of fall semester students and µs indicate the mean GPA of spring semester students. Ho: µF - µs Sv Ha:HF - Hs (So we will be performing a right-tailed v test.) Part 2 of 4 Step 2: Assuming the null hypothesis is true, determine the features of the distribution of the differences of sample means. with distribution mean 34.7 The differences of sample means are t-distributed and distribution standard deviation 34.7
Part 1 ot college professor believes that students achieve a higher grade point average (GPA) in the fall emester than in the spring semester. To test her theory, she samples 32 of her fall semester tudents and 46 of her spring semester students. The fall semester students had an average semester GPA of 3.44 with a standard deviation of 0.3; the spring semester students had an average semester GPA of 3.28 with a standard deviation of 0.35. If the GPAS in both student populations are- normally distributed, conduct a hypothesis test using a 4% level of significance to test the professor's theory. Step 1: State the null and alternative hypotheses. Let µf indicate the mean GPA of fall semester students and µs indicate the mean GPA of spring semester students. Ho: µF - µs Sv Ha:HF - Hs (So we will be performing a right-tailed v test.) Part 2 of 4 Step 2: Assuming the null hypothesis is true, determine the features of the distribution of the differences of sample means. with distribution mean 34.7 The differences of sample means are t-distributed and distribution standard deviation 34.7

MATLAB: An Introduction with Applications
6th Edition
ISBN:9781119256830
Author:Amos Gilat
Publisher:Amos Gilat
Chapter1: Starting With Matlab
Section: Chapter Questions
Problem 1P

Related questions
Topic Video
Question
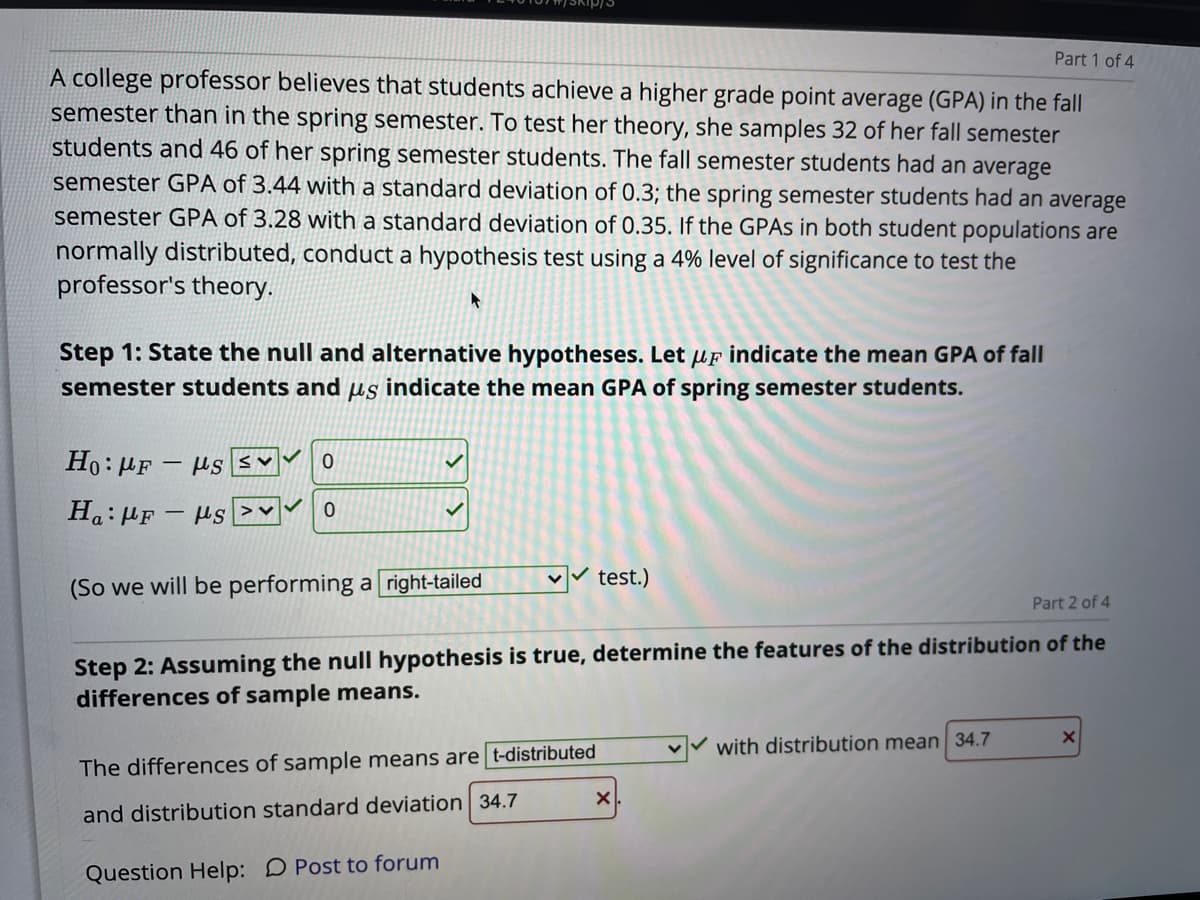
Transcribed Image Text:Part 1 of 4
A college professor believes that students achieve a higher grade point average (GPA) in the fall
semester than in the spring semester. To test her theory, she samples 32 of her fall semester
students and 46 of her spring semester students. The fall semester students had an average
semester GPA of 3.44 with a standard deviation of 0.3; the spring semester students had an average
semester GPA of 3.28 with a standard deviation of 0.35. If the GPAS in both student populations are
normally distributed, conduct a hypothesis test using a 4% level of significance to test the
professor's theory.
Step 1: State the null and alternative hypotheses. Let µ f indicate the mean GPA of fall
semester students and us indicate the mean GPA of spring semester students.
Ho: µF - Hs SV
H: HF - us
(So we will be performing a right-tailed
v test.)
Part 2 of 4
Step 2: Assuming the null hypothesis is true, determine the features of the distribution of the
differences of sample means.
with distribution mean 34.7
The differences of sample means are t-distributed
and distribution standard deviation 34.7
Question Help: D Post to forum
Expert Solution
This question has been solved!
Explore an expertly crafted, step-by-step solution for a thorough understanding of key concepts.

Step by step
Solved in 2 steps with 1 images

Knowledge Booster


Learn more about
Need a deep-dive on the concept behind this application? Look no further. Learn more about this topic, statistics and related others by exploring similar questions and additional content below.Recommended textbooks for you
MATLAB: An Introduction with Applications
Statistics
ISBN:
9781119256830
Author:
Amos Gilat
Publisher:
John Wiley & Sons Inc

Probability and Statistics for Engineering and th…
Statistics
ISBN:
9781305251809
Author:
Jay L. Devore
Publisher:
Cengage Learning

Statistics for The Behavioral Sciences (MindTap C…
Statistics
ISBN:
9781305504912
Author:
Frederick J Gravetter, Larry B. Wallnau
Publisher:
Cengage Learning
MATLAB: An Introduction with Applications
Statistics
ISBN:
9781119256830
Author:
Amos Gilat
Publisher:
John Wiley & Sons Inc
Probability and Statistics for Engineering and th…
Statistics
ISBN:
9781305251809
Author:
Jay L. Devore
Publisher:
Cengage Learning
Statistics for The Behavioral Sciences (MindTap C…
Statistics
ISBN:
9781305504912
Author:
Frederick J Gravetter, Larry B. Wallnau
Publisher:
Cengage Learning

Elementary Statistics: Picturing the World (7th E…
Statistics
ISBN:
9780134683416
Author:
Ron Larson, Betsy Farber
Publisher:
PEARSON

The Basic Practice of Statistics
Statistics
ISBN:
9781319042578
Author:
David S. Moore, William I. Notz, Michael A. Fligner
Publisher:
W. H. Freeman

Introduction to the Practice of Statistics
Statistics
ISBN:
9781319013387
Author:
David S. Moore, George P. McCabe, Bruce A. Craig
Publisher:
W. H. Freeman