Plan production for a four-month period: February through May. For February and March, you should produce to exact demand forecast. For April and May, you should use overtime and inventory with a stable workforce; stable means that the number of workers needed for March will be held constant through May. However, government constraints put a maximum of 5,000 hours of overtime labor per month in April and May (zero overtime in February and March). If demand exceeds supply, then backorders occur. There are 110 workers on January 31. You are given the following demand forecast: February, 81,920; March, 70,400; April, 100,040; May, 40,040. Productivity is four units per worker hour, eight hours per day, 20 days per month. Assume zero inventory on February 1. Costs are hiring, $50 per new worker; layoff, $70 per worker laid off; inventory holding, $11 per unit-month; straight-time labor, $12 per hour; overtime, $18 per hour; backorder, $22 per unit. Develop a production plan and calculate the total cost of this plan. Note: Assume any layoffs occur at beginning of next month. (Leave no cells blank - be certain to enter "O" wherever required. Negative values should be indicated by a minus sign. Round your answers to the nearest whole number.)
Plan production for a four-month period: February through May. For February and March, you should produce to exact demand forecast. For April and May, you should use overtime and inventory with a stable workforce; stable means that the number of workers needed for March will be held constant through May. However, government constraints put a maximum of 5,000 hours of overtime labor per month in April and May (zero overtime in February and March). If demand exceeds supply, then backorders occur. There are 110 workers on January 31. You are given the following demand forecast: February, 81,920; March, 70,400; April, 100,040; May, 40,040. Productivity is four units per worker hour, eight hours per day, 20 days per month. Assume zero inventory on February 1. Costs are hiring, $50 per new worker; layoff, $70 per worker laid off; inventory holding, $11 per unit-month; straight-time labor, $12 per hour; overtime, $18 per hour; backorder, $22 per unit. Develop a production plan and calculate the total cost of this plan. Note: Assume any layoffs occur at beginning of next month. (Leave no cells blank - be certain to enter "O" wherever required. Negative values should be indicated by a minus sign. Round your answers to the nearest whole number.)

Practical Management Science
6th Edition
ISBN:9781337406659
Author:WINSTON, Wayne L.
Publisher:WINSTON, Wayne L.
Chapter2: Introduction To Spreadsheet Modeling
Section: Chapter Questions
Problem 20P: Julie James is opening a lemonade stand. She believes the fixed cost per week of running the stand...

Related questions
Question
Please simply fill out the chart
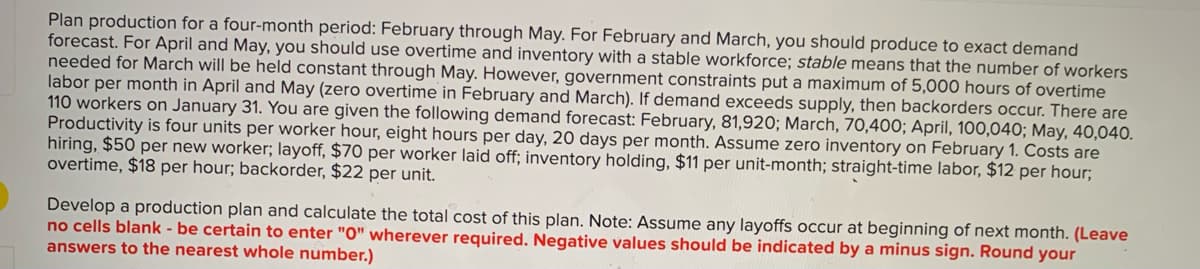
Transcribed Image Text:Plan production for a four-month period: February through May. For February and March, you should produce to exact demand
forecast. For April and May, you should use overtime and inventory with a stable workforce; stable means that the number of workers
needed for March will be held constant through May. However, government constraints put a maximum of 5,000 hours of overtime
labor per month in April and May (zero overtime in February and March). If demand exceeds supply, then backorders occur. There are
110 workers on January 31. You are given the following demand forecast: February, 81,920; March, 70,400; April, 100,040; May, 40,040.
Productivity is four units per worker hour, eight hours per day, 20 days per month. Assume zero inventory on February 1. Costs are
hiring, $50 per new worker; layoff, $70 per worker laid off; inventory holding, $11 per unit-month; straight-time labor, $12 per hour;
overtime, $18 per hour; backorder, $22 per unit.
Develop a production plan and calculate the total cost of this plan. Note: Assume any layoffs occur at beginning of next month. (Leave
no cells blank - be certain to enter "0" wherever required. Negative values should be indicated by a minus sign. Round your
answers to the nearest whole number.)
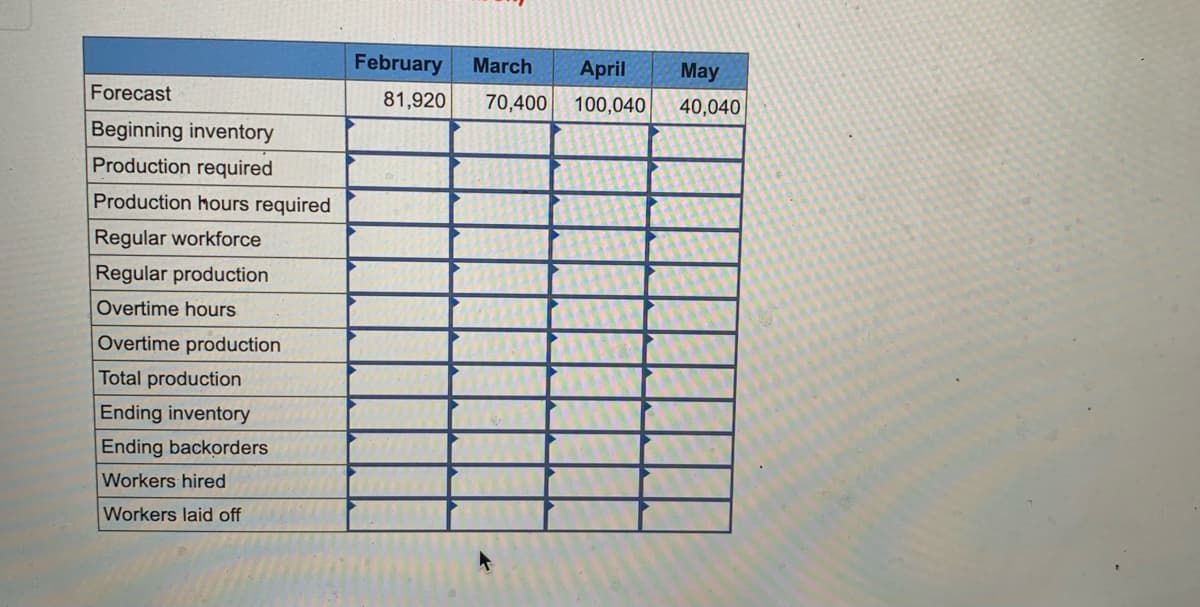
Transcribed Image Text:February
March
April
May
Forecast
81,920
70,400
100,040
40,040
Beginning inventory
Production required
Production hours required
Regular workforce
Regular production
Overtime hours
Overtime production
Total production
Ending inventory
Ending backorders
Workers hired
Workers laid off
Expert Solution
This question has been solved!
Explore an expertly crafted, step-by-step solution for a thorough understanding of key concepts.

This is a popular solution!

Trending now
This is a popular solution!

Step by step
Solved in 2 steps with 2 images

Recommended textbooks for you
Practical Management Science
Operations Management
ISBN:
9781337406659
Author:
WINSTON, Wayne L.
Publisher:
Cengage,

Operations Management
Operations Management
ISBN:
9781259667473
Author:
William J Stevenson
Publisher:
McGraw-Hill Education

Operations and Supply Chain Management (Mcgraw-hi…
Operations Management
ISBN:
9781259666100
Author:
F. Robert Jacobs, Richard B Chase
Publisher:
McGraw-Hill Education
Practical Management Science
Operations Management
ISBN:
9781337406659
Author:
WINSTON, Wayne L.
Publisher:
Cengage,
Operations Management
Operations Management
ISBN:
9781259667473
Author:
William J Stevenson
Publisher:
McGraw-Hill Education
Operations and Supply Chain Management (Mcgraw-hi…
Operations Management
ISBN:
9781259666100
Author:
F. Robert Jacobs, Richard B Chase
Publisher:
McGraw-Hill Education


Purchasing and Supply Chain Management
Operations Management
ISBN:
9781285869681
Author:
Robert M. Monczka, Robert B. Handfield, Larry C. Giunipero, James L. Patterson
Publisher:
Cengage Learning

Production and Operations Analysis, Seventh Editi…
Operations Management
ISBN:
9781478623069
Author:
Steven Nahmias, Tava Lennon Olsen
Publisher:
Waveland Press, Inc.