Please help by showing all workings and explanations

Holt Mcdougal Larson Pre-algebra: Student Edition 2012
1st Edition
ISBN:9780547587776
Author:HOLT MCDOUGAL
Publisher:HOLT MCDOUGAL
Chapter11: Data Analysis And Probability
Section: Chapter Questions
Problem 8CR

Related questions
Question
Please help by showing all workings and explanations
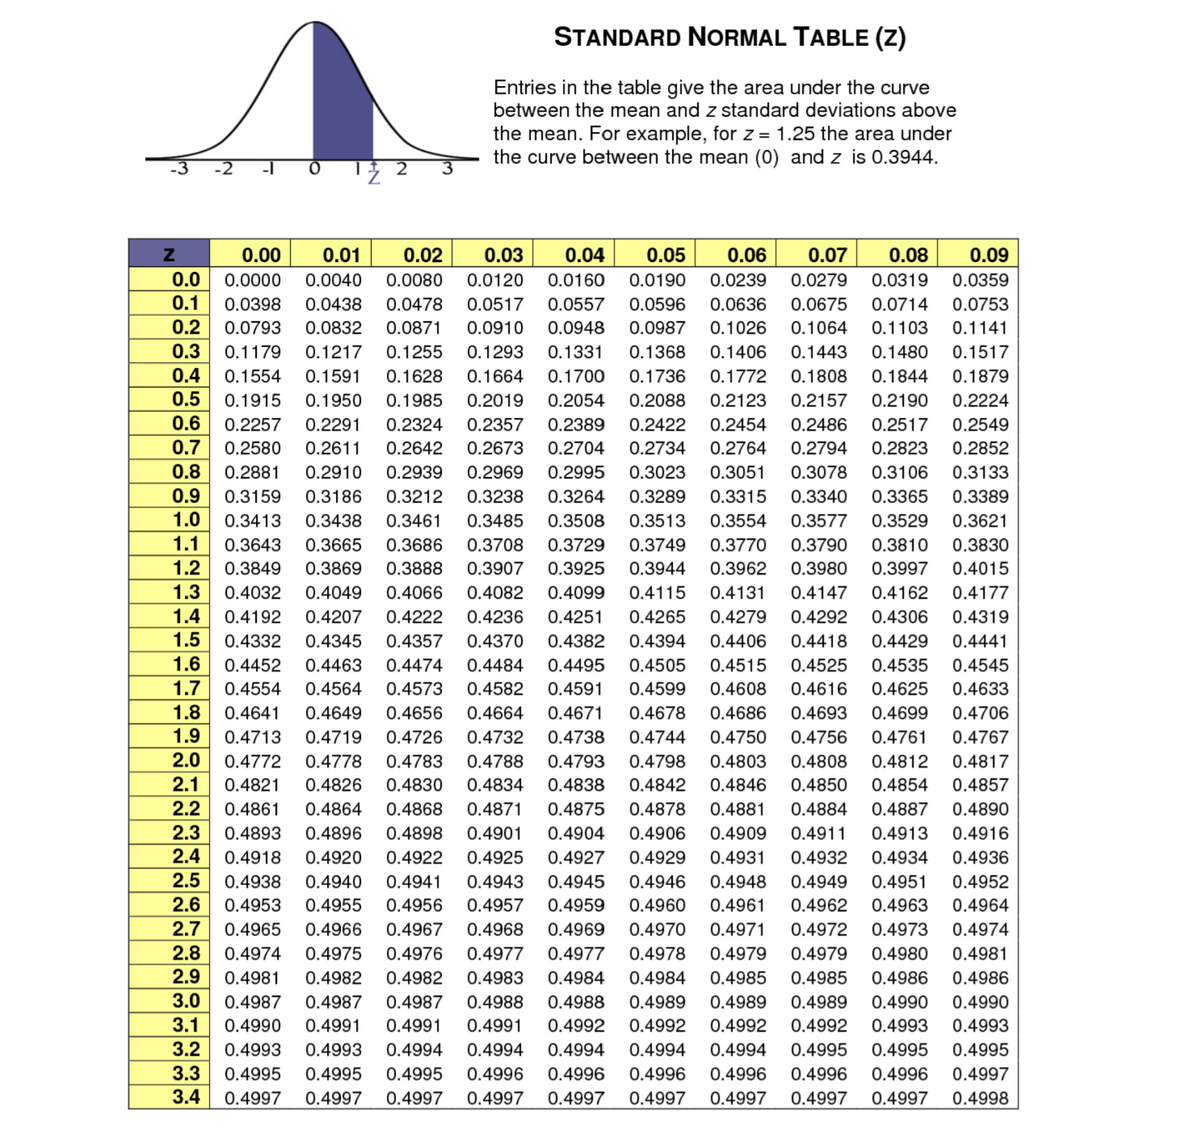
Transcribed Image Text:STANDARD NORMAL TABLE (z)
Entries in the table give the area under the curve
between the mean and z standard deviations above
the mean. For example, for z = 1.25 the area under
the curve between the mean (0) and z is 0.3944.
0.00
0.01
0.02
0.03
0.04
0.05
0.06
0.07
0.08
0.09
0.0
0.0000
0.0040
0.0080
0.0120
0.0160
0.0190
0.0239
0.0279
0.0319
0.0359
0.1
0.0398
0.0438
0.0478
0.0517
0.0557
0.0596
0.0636
0.0675
0.0714
0.0753
0.2
0.0793
0.0832
0.0871
0.0910
0.0948
0.0987
0.1026
0.1064
0.1103
0.1141
0.3
0.4
0.1179
0.1217
0.1255
0.1293
0.1331
0.1368
0.1406
0.1443
0.1480
0.1517
0.1554
0.1591
0.1628
0.1664
0.1700
0.1736
0.1772
0.1808
0.1844
0.1879
0.5
0.1915
0.1950
0.1985
0.2019
0.2054
0.2088
0.2123
0.2157
0.2190
0.2224
0.6
0.2257
0.2291
0.2324
0.2357
0.2389
0.2422
0.2454
0.2486
0.2517
0.2549
0.7
0.2580
0.2611
0.2642
0.2673
0.2704
0.2734
0.2764
0.2794
0.2823
0.2852
0.8
0.2881
0.2910
0.2939
0.2969
0.2995
0.3023
0.3051
0.3078
0.3106
0.3133
0.9
0.3159
0.3186
0.3212
0.3238
0.3264
0.3289
0.3315
0.3340
0.3365
0.3389
1.0
0.3413
0.3438
0.3461
0.3485
0.3508
0.3513
0.3554
0.3577
0.3529
0.3621
1.1
0.3643
0.3665
0.3686
0.3708
0.3729
0.3749
0.3770
0.3790
0.3810
0.3830
1.2
0.3849
0.3869
0.3888
0.3907
0.3925
0.3944
0.3962
0.3980
0.3997
0.4015
1.3
0.4032
0.4049
0.4066
0.4082
0.4099
0.4115
0.4131
0.4147
0.4162
0.4177
1.4
0.4192
0.4207
0.4222
0.4236
0.4251
0.4265
0.4279
0.4292
0.4306
0.4319
1.5
0.4332
0.4345
0.4357
0.4370
0.4382
0.4394
0.4406
0.4418
0.4429
0.4441
1.6
0.4452
0.4463
0.4474
0.4484
0.4495
0.4505
0.4515
0.4525
0.4535
0.4545
1.7
0.4554
0.4564
0.4573
0.4582
0.4591
0.4599
0.4608
0.4616
0.4625
0.4633
1.8
0.4641
0.4649
0.4656
0.4664
0.4671
0.4678
0.4686
0.4693
0.4699
0.4706
1.9
0.4713
0.4719
0.4726
0.4732
0.4738
0.4744
0.4750
0.4756
0.4761
0.4767
2.0
0.4772
0.4778
0.4783
0.4788
0.4793
0.4798
0.4803
0.4808
0.4812
0.4817
2.1
0.4821
0.4826
0.4830
0.4834
0.4838
0.4842
0.4846
0.4850
0.4854
0.4857
2.2
0.4861
0.4864
0.4868
0.4871
0.4875
0.4878
0.4881
0.4884
0.4887
0.4890
2.3
0.4893
0.4896
0.4898
0.4901
0.4904
0.4906
0.4909
0.4911
0.4913
0.4916
2.4
0.4918
0.4920
0.4922
0.4925
0.4927
0.4929
0.4931
0.4932
0.4934
0.4936
2.5
0.4938
0.4940
0.4941
0.4943
0.4945
0.4946
0.4948
0.4949
0.4951
0.4952
2.6
0.4953
0.4955
0.4956
0.4957
0.4959
0.4960
0.4961
0.4962
0.4963
0.4964
2.7
0.4965
0.4966
0.4967
0.4968
0.4969
0.4970
0.4971
0.4972
0.4973
0.4974
2.8
2.9
0.4974
0.4975
0.4976
0.4977
0.4977
0.4978
0.4979
0.4979
0.4980
0.4981
0.4981
0.4982
0.4982
0.4983
0.4984
0.4984
0.4985
0.4985
0.4986
0.4986
3.0
0.4987
0.4987
0.4987
0.4988
0.4988
0.4989
0.4989
0.4989
0.4990
0.4990
3.1
0.4990
0.4991
0.4991
0.4991
0.4992
0.4992
0.4992
0.4992
0.4993
0.4993
3.2
0.4993
0.4993
0.4994
0.4994
0.4994
0.4994
0.4994
0.4995
0.4995
0.4995
3.3
0.4995
0.4995
0.4995
0.4996
0.4996
0.4996
0.4996
0.4996
0.4996
0.4997
3.4
0.4997
0.4997
0.4997
0.4997
0.4997
0.4997
0.4997
0.4997
0.4997
0.4998
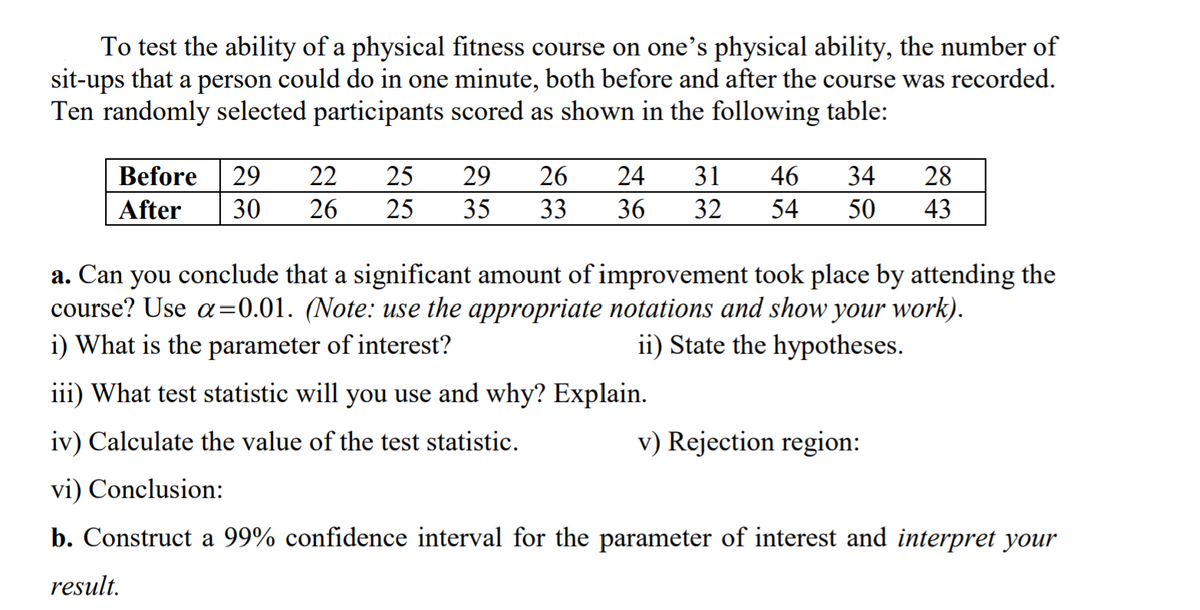
Transcribed Image Text:To test the ability of a physical fitness course on one's physical ability, the number of
sit-ups that a person could do in one minute, both before and after the course was recorded.
Ten randomly selected participants scored as shown in the following table:
Before
29
22
25
29
26
24
31
46
34
28
After
30
26
25
35
33
36
32
54
50
43
a. Can you conclude that a significant amount of improvement took place by attending the
course? Use a=0.01. (Note: use the appropriate notations and show your work).
i) What is the parameter of interest?
%3D
ii) State the hypotheses.
iii) What test statistic will you use and why? Explain.
iv) Calculate the value of the test statistic.
v) Rejection region:
vi) Conclusion:
b. Construct a 99% confidence interval for the parameter of interest and interpret your
result.
Expert Solution
This question has been solved!
Explore an expertly crafted, step-by-step solution for a thorough understanding of key concepts.

Step by step
Solved in 2 steps with 5 images

Knowledge Booster


Learn more about
Need a deep-dive on the concept behind this application? Look no further. Learn more about this topic, statistics and related others by exploring similar questions and additional content below.Recommended textbooks for you
Holt Mcdougal Larson Pre-algebra: Student Edition…
Algebra
ISBN:
9780547587776
Author:
HOLT MCDOUGAL
Publisher:
HOLT MCDOUGAL

Glencoe Algebra 1, Student Edition, 9780079039897…
Algebra
ISBN:
9780079039897
Author:
Carter
Publisher:
McGraw Hill
Holt Mcdougal Larson Pre-algebra: Student Edition…
Algebra
ISBN:
9780547587776
Author:
HOLT MCDOUGAL
Publisher:
HOLT MCDOUGAL
Glencoe Algebra 1, Student Edition, 9780079039897…
Algebra
ISBN:
9780079039897
Author:
Carter
Publisher:
McGraw Hill