Plot the appropriate graphs to find: - The approximate Vmax from the Michaelis-Menten curve.

Biomedical Instrumentation Systems
1st Edition
ISBN:9781133478294
Author:Chatterjee
Publisher:Chatterjee
Chapter6: Biomedical Electrodes, Sensors, And Transducers
Section: Chapter Questions
Problem 7Q
icon
Related questions
Question

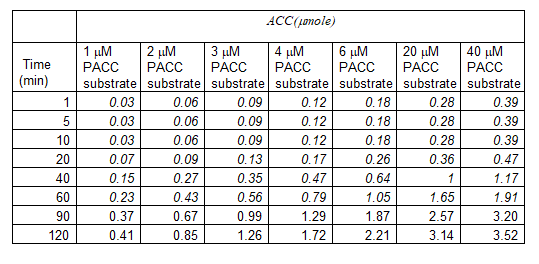
The SARS-Cov-2 virus is the virus that cause COVID-19. The viral protease is a known target for finding potential viral inhibitor. The activity of the viral protease can be assayed using the synthetic peptide substrate attached to 7-amino-4-carbamoylmethylcoumarin (PACC). The viral protease cleaved the substrate producing the fluorogenic ACC which can be monitored using a spectrofluorometer. The following is data from SARS-Cov-2 protease (0.1 mg of enzyme) upon reaction with various concentrations of the substrate PACC. 

Plot the appropriate graphs to find:

- The approximate Vmax from the Michaelis-Menten curve.
Time
(min)
1
5
10
20
40
60
90
120
1 μM
PACC
substrate
0.03
0.03
0.03
0.07
0.15
0.23
0.37
0.41
2 μM
PACC
substrate
0.06
0.06
0.06
0.09
0.27
0.43
0.67
0.85
ACC (janole)
3 μM
4 μM
6 μM
20 μM
PACC
PACC
PACC
PACC
substrate substrate substrate substrate
0.09
0.09
0.09
0.13
0.35
0.56
0.99
1.26
0.12
0.12
0.12
0.17
0.47
0.79
1.29
1.72
0.18
0.18
0.18
0.26
0.64
1.05
1.87
2.21
0.28
0.28
0.28
0.36
1
1.65
2.57
3.14
40 μM
PACC
substrate
0.39
0.39
0.39
0.47
1.17
1.91
3.20
3.52
Transcribed Image Text:Time (min) 1 5 10 20 40 60 90 120 1 μM PACC substrate 0.03 0.03 0.03 0.07 0.15 0.23 0.37 0.41 2 μM PACC substrate 0.06 0.06 0.06 0.09 0.27 0.43 0.67 0.85 ACC (janole) 3 μM 4 μM 6 μM 20 μM PACC PACC PACC PACC substrate substrate substrate substrate 0.09 0.09 0.09 0.13 0.35 0.56 0.99 1.26 0.12 0.12 0.12 0.17 0.47 0.79 1.29 1.72 0.18 0.18 0.18 0.26 0.64 1.05 1.87 2.21 0.28 0.28 0.28 0.36 1 1.65 2.57 3.14 40 μM PACC substrate 0.39 0.39 0.39 0.47 1.17 1.91 3.20 3.52
Expert Solution
steps

Step by step

Solved in 5 steps with 1 images

Blurred answer
Follow-up Questions
Read through expert solutions to related follow-up questions below.
Follow-up Question

From the graphs given, can you find the  Km from the Michaelis-Menten curve and the Lineweaver-Burke plot.

Solution
Bartleby Expert
SEE SOLUTION
Knowledge Booster
Secondary Metabolites
Learn more about
Need a deep-dive on the concept behind this application? Look no further. Learn more about this topic, biology and related others by exploring similar questions and additional content below.
Similar questions
  • SEE MORE QUESTIONS
Recommended textbooks for you
Biomedical Instrumentation Systems
Chemistry
ISBN:
9781133478294
Author:
Chatterjee
Publisher:
Cengage
Basic Clinical Laboratory Techniques 6E
Biology
ISBN:
9781133893943
Author:
ESTRIDGE
Publisher:
Cengage
Biochemistry
Biochemistry
Biochemistry
ISBN:
9781305577206
Author:
Reginald H. Garrett, Charles M. Grisham
Publisher:
Cengage Learning