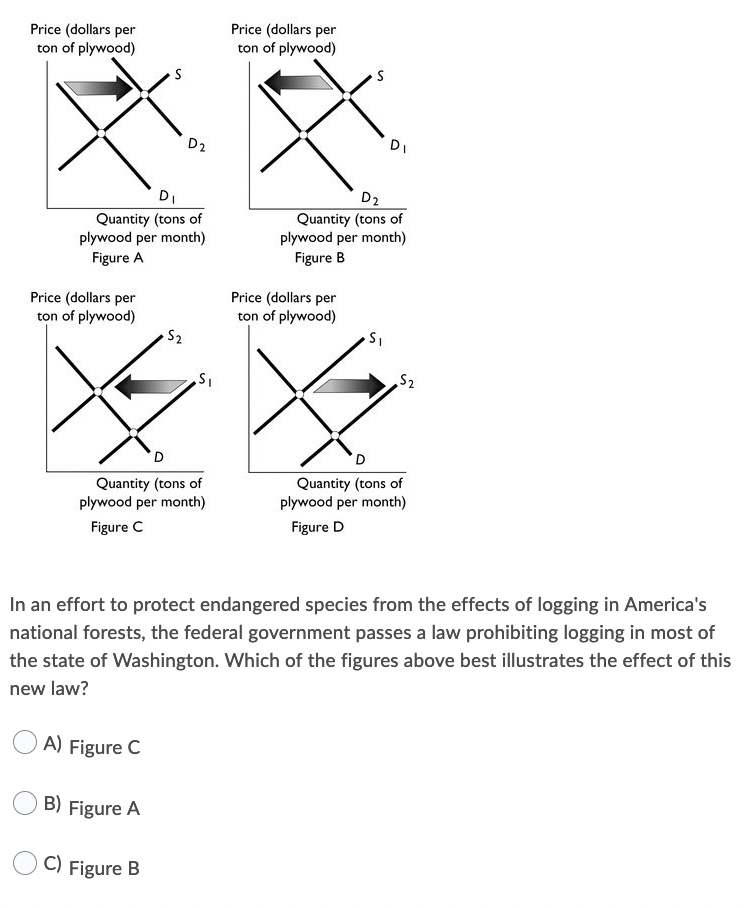
Price (dollars per Price (dollars per ton of plywood) ton of plywood) D2 DI DI D2 Quantity (tons of plywood per month) Figure A Quantity (tons of plywood per month) Figure B Price (dollars per Price (dollars per ton of plywood) S2 ton of plywood) 52 Quantity (tons of plywood per month) Quantity (tons of plywood per month) Figure C Figure D n an effort to protect endangered species from the effects of logging in America's hational forests, the federal government passes a law prohibiting logging in most of the state of Washington. Which of the figures above best illustrates the effect of this new law? A) Figure C B) Figure A C) Figure B
Price (dollars per Price (dollars per ton of plywood) ton of plywood) D2 DI DI D2 Quantity (tons of plywood per month) Figure A Quantity (tons of plywood per month) Figure B Price (dollars per Price (dollars per ton of plywood) S2 ton of plywood) 52 Quantity (tons of plywood per month) Quantity (tons of plywood per month) Figure C Figure D n an effort to protect endangered species from the effects of logging in America's hational forests, the federal government passes a law prohibiting logging in most of the state of Washington. Which of the figures above best illustrates the effect of this new law? A) Figure C B) Figure A C) Figure B

Chapter1: Making Economics Decisions
Section: Chapter Questions
Problem 1QTC

Related questions

Question
100%
Transcribed Image Text:Price (dollars per
ton of plywood)
Price (dollars per
ton of plywood)
D2
DI
DI
D2
Quantity (tons of
plywood per month)
Quantity (tons of
plywood per month)
Figure A
Figure B
Price (dollars per
ton of plywood)
S2
Price (dollars per
ton of plywood)
Quantity (tons of
plywood per month)
Quantity (tons of
plywood per month)
Figure C
Figure D
In an effort to protect endangered species from the effects of logging in America's
national forests, the federal government passes a law prohibiting logging in most of
the state of Washington. Which of the figures above best illustrates the effect of this
new law?
A) Figure C
B) Figure A
C) Figure B
Expert Solution
This question has been solved!
Explore an expertly crafted, step-by-step solution for a thorough understanding of key concepts.

This is a popular solution!

Trending now
This is a popular solution!

Step by step
Solved in 2 steps with 1 images

Knowledge Booster


Learn more about
Need a deep-dive on the concept behind this application? Look no further. Learn more about this topic, economics and related others by exploring similar questions and additional content below.Recommended textbooks for you

Principles of Economics (12th Edition)
Economics
ISBN:
9780134078779
Author:
Karl E. Case, Ray C. Fair, Sharon E. Oster
Publisher:
PEARSON

Engineering Economy (17th Edition)
Economics
ISBN:
9780134870069
Author:
William G. Sullivan, Elin M. Wicks, C. Patrick Koelling
Publisher:
PEARSON
Principles of Economics (12th Edition)
Economics
ISBN:
9780134078779
Author:
Karl E. Case, Ray C. Fair, Sharon E. Oster
Publisher:
PEARSON
Engineering Economy (17th Edition)
Economics
ISBN:
9780134870069
Author:
William G. Sullivan, Elin M. Wicks, C. Patrick Koelling
Publisher:
PEARSON

Principles of Economics (MindTap Course List)
Economics
ISBN:
9781305585126
Author:
N. Gregory Mankiw
Publisher:
Cengage Learning

Managerial Economics: A Problem Solving Approach
Economics
ISBN:
9781337106665
Author:
Luke M. Froeb, Brian T. McCann, Michael R. Ward, Mike Shor
Publisher:
Cengage Learning

Managerial Economics & Business Strategy (Mcgraw-…
Economics
ISBN:
9781259290619
Author:
Michael Baye, Jeff Prince
Publisher:
McGraw-Hill Education