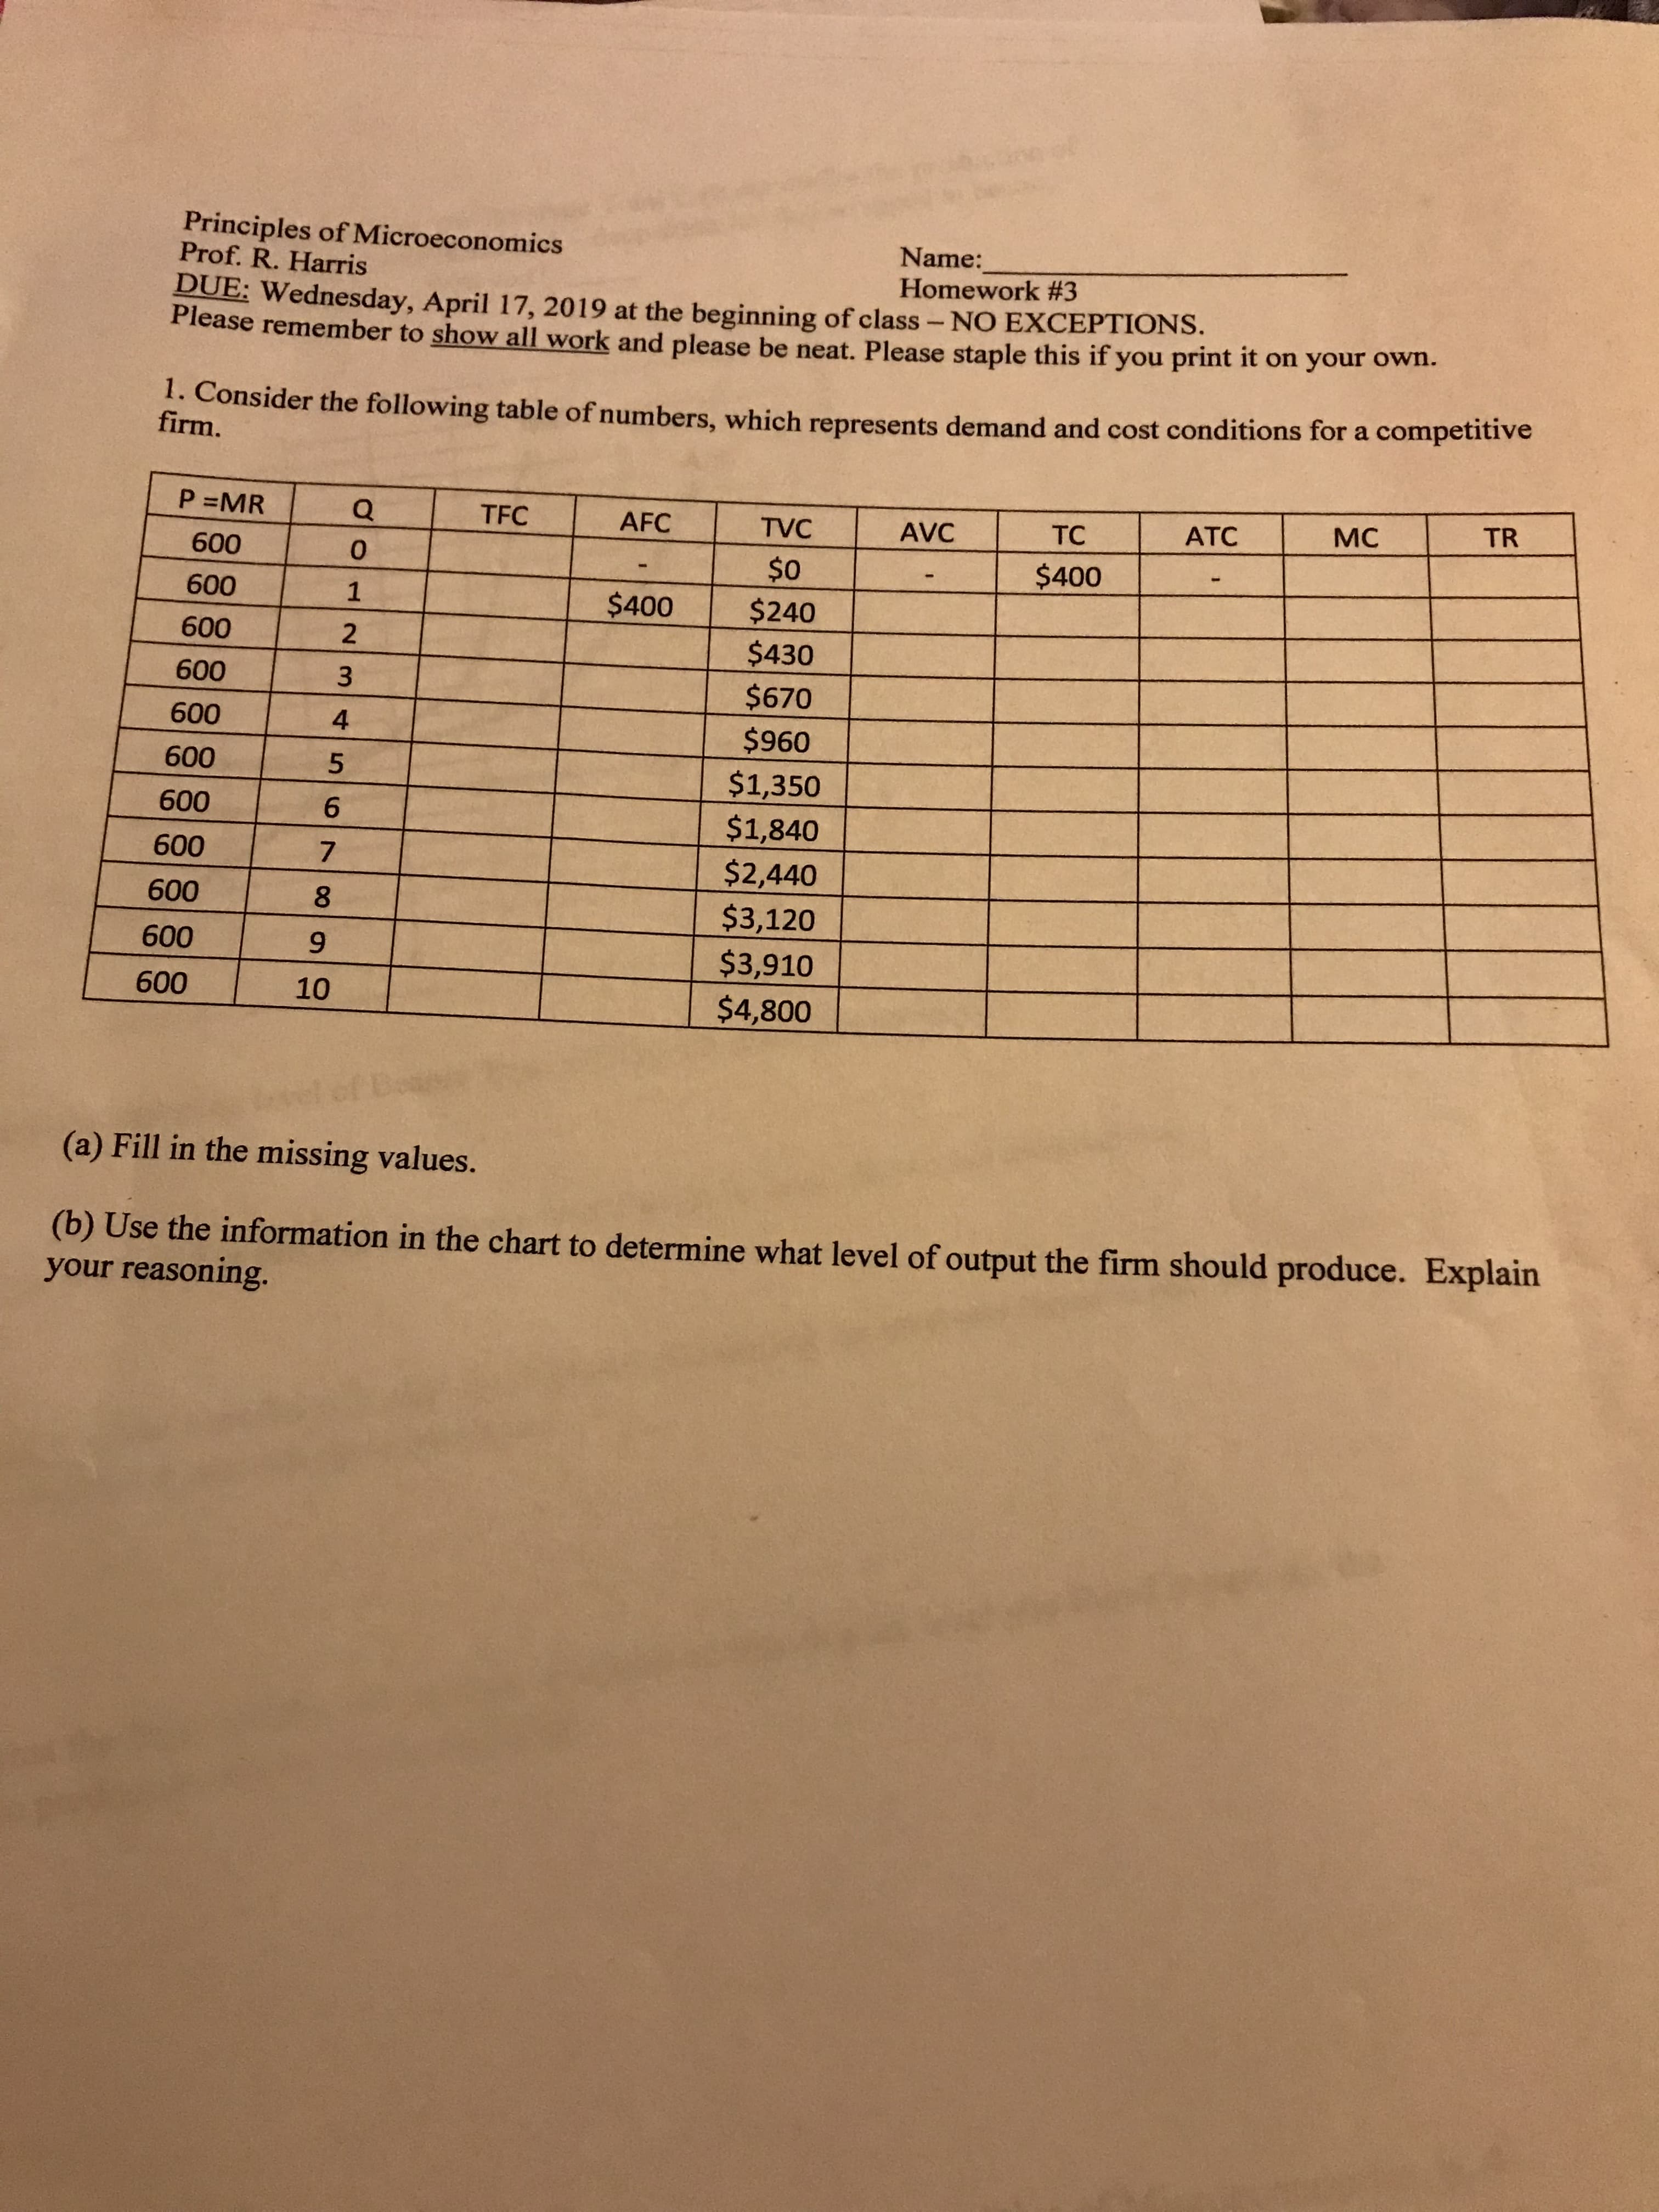
Principles of Microeconomics Name: Homework #3 Prof. R. Harris DUE: Wednesday, April 17, 2019 at the beginning of class - NO EXCEPTIONS. Please remember to show all work and please be neat. Please staple this if you print it on your own. 1. Consider the following table of numbers, which represents demand and cost conditions for a com firm. petitive TR 600 0 1 2 $o $400 600 $400 $240 600 $430 $670 $960 $1,350 $1,840 $2,440 $3,120 $3,910 $4,800 600 600 600 600 600 600 5 6 7 600 600 9 10 (a) Fill in the missing values (b) Use the information in the chart to determine what level of output the firm should produce. Explain your reasoning.


Let us first understand what the following costs mean:
Total Cost (TC): Total costs are the total outlay in production activity.
Total Fixed Costs (TFC): Fixed costs are the costs that once incurred remain same at all levels of output.
Total Variable Costs (TVC): Variable costs are the costs that vary with the level of output.
Average Total Cost (ATC): Average total cost is the total cost per unit of output.
Average Fixed Cost (AFC): Average fixed cost is the fixed cost per unit of output.
Average Variable Cost (AVC): Average variable cost is the variable cost per unit of output.
Marginal Cost (MC): Marginal cost is the addition to total cost when an extra unit of output is produced.
Total Revenue (TR): Total Revenue is the total proceeds from the sale of a given level of output.
Profits (π): Profits are the total revenue (TR) net of total costs (TC).
The formulas for calculating the missing values are as follows:
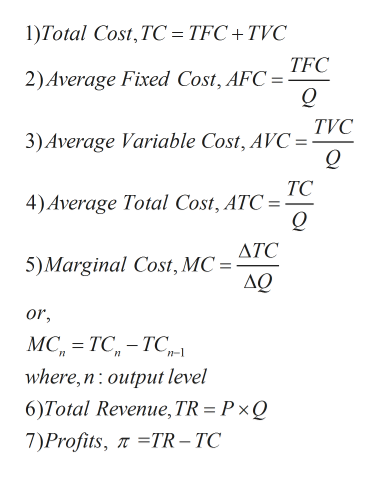
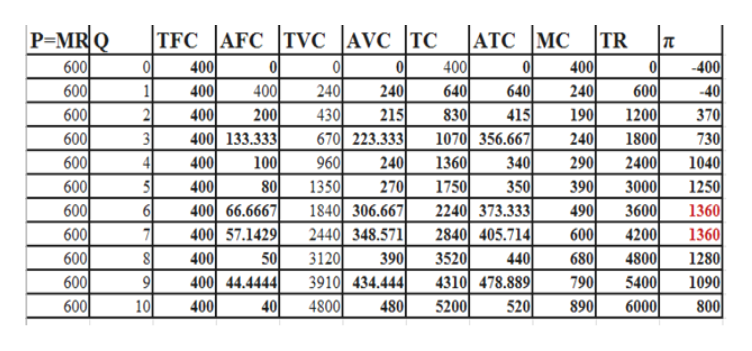
a) The missing values are found out using the above formulas and are as follows:

Step by step
Solved in 5 steps with 3 images
