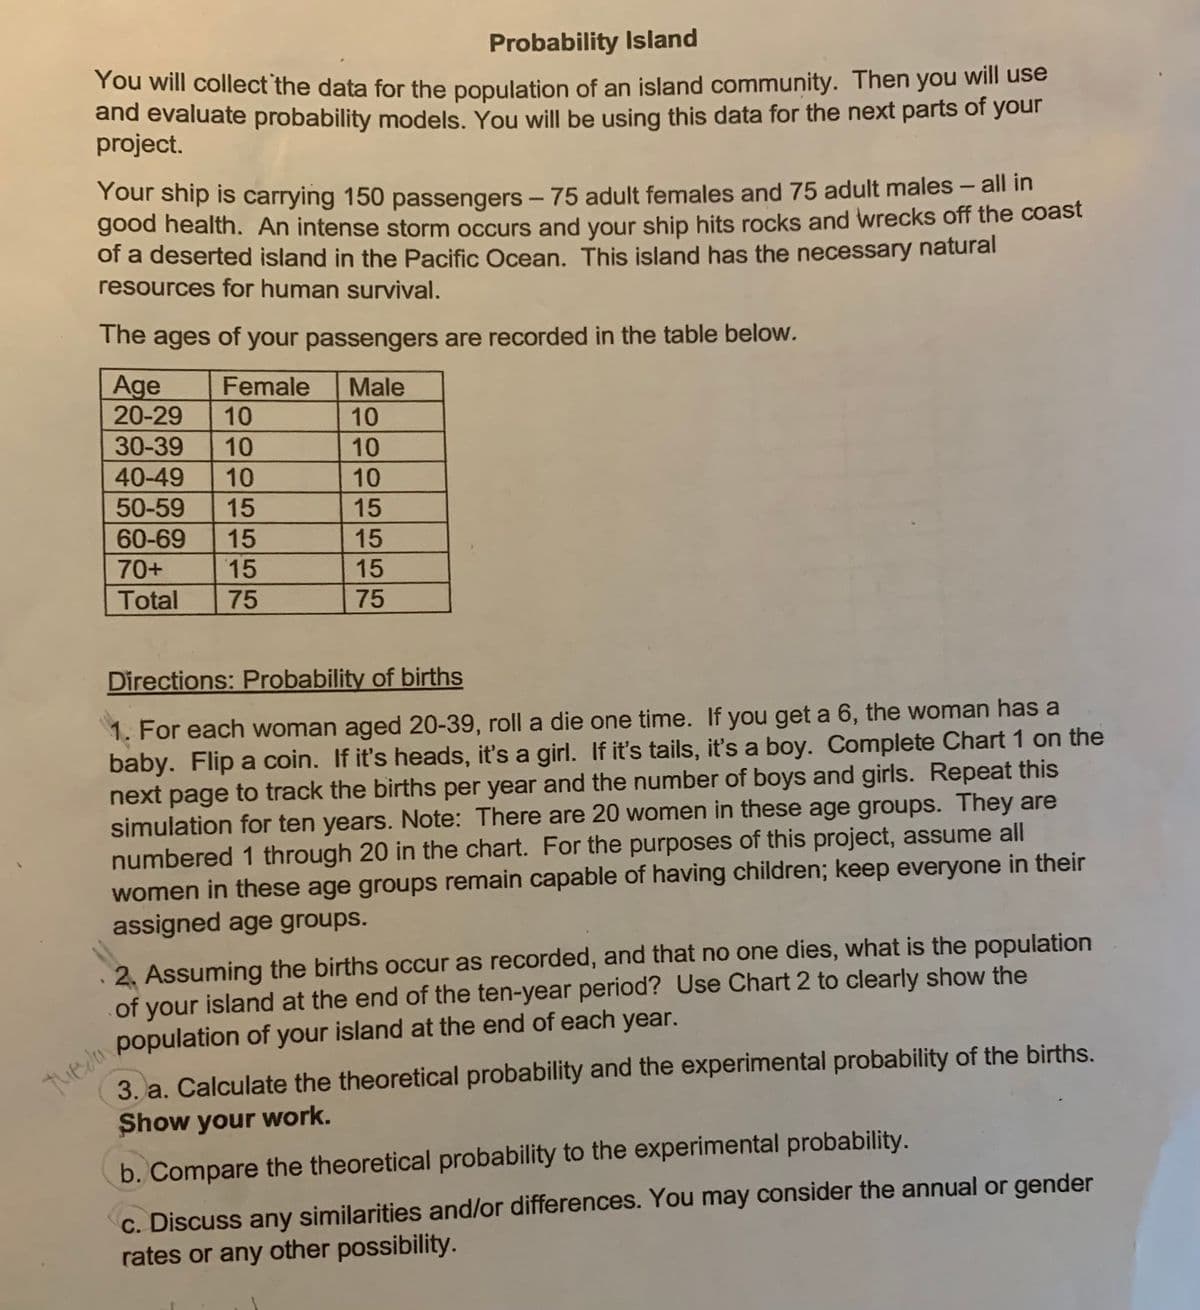
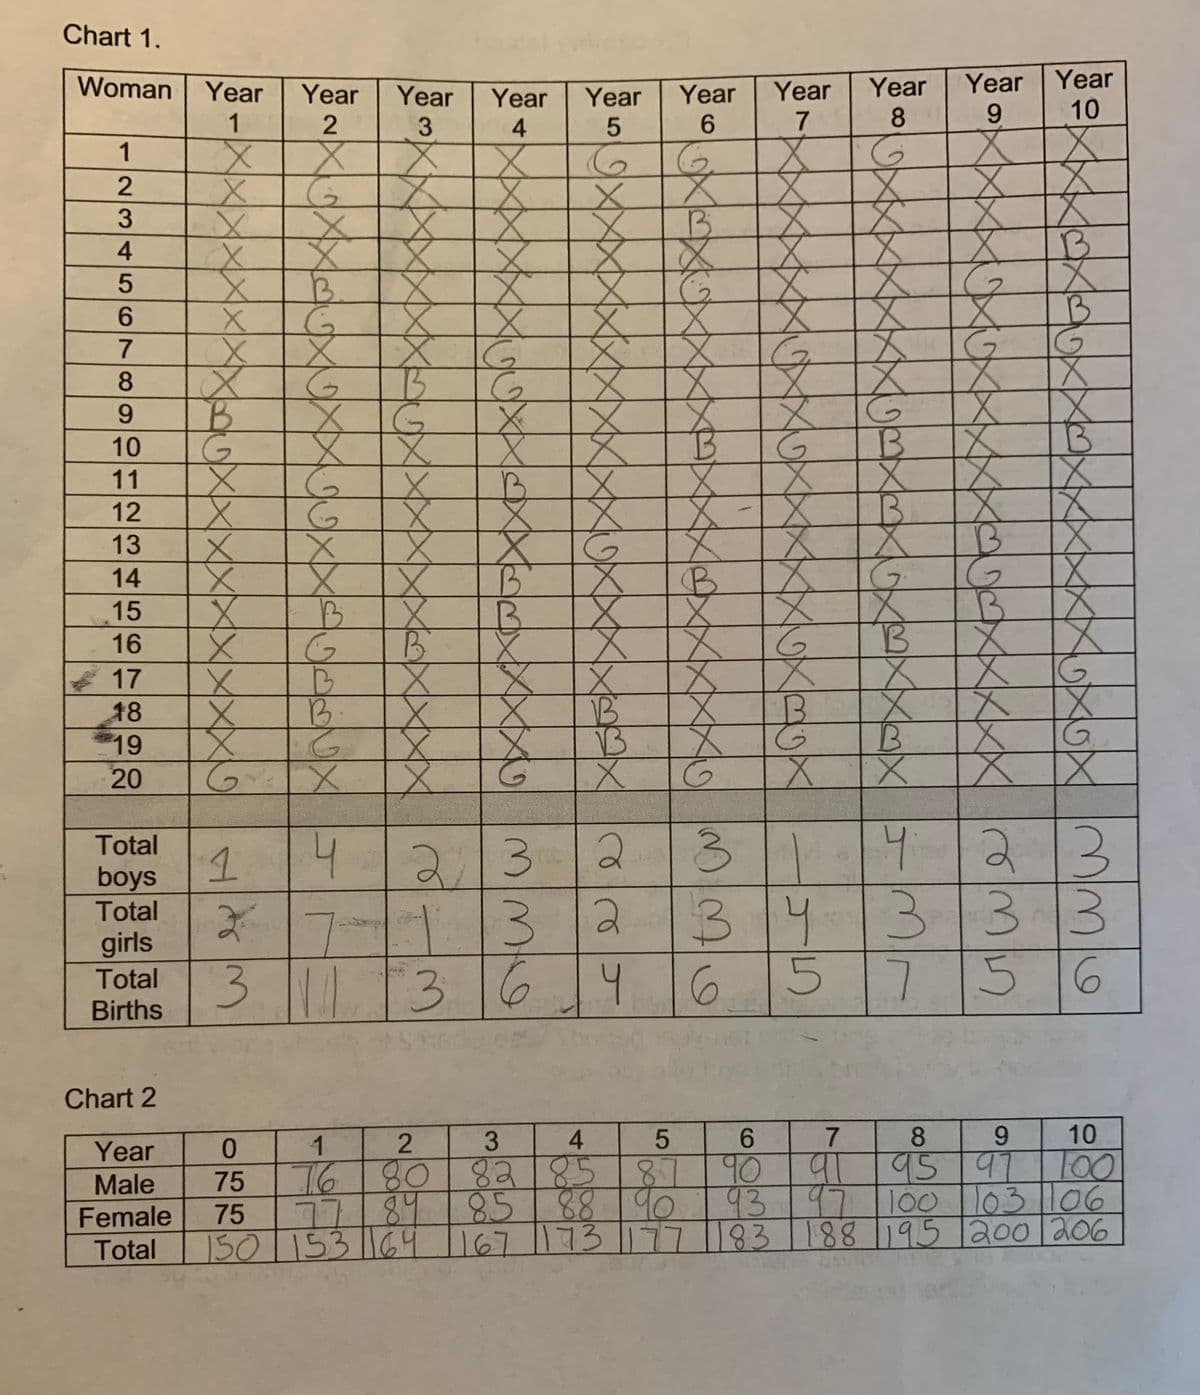
Probability Island You will collect the data for the population of an island community. Then you will use and evaluate probability models. You will be using this data for the next parts of your project. Your ship is carrying 150 passengers - 75 adult females and 75 adult males - all in good health. An intense storm occurs and your ship hits rocks and wrecks off the coast of a deserted island in the Pacific Ocean. This island has the necessary natural resources for human survival. The ages of your passengers are recorded in the table below. Age Female Male 20-29 10 10 30-39 10 10 40-49 10 10 50-59 15 15 60-69 15 15 70+ 15 15 Total 75 75 Directions: Probability of births 1. For each woman aged 20-39, roll a die one time. If you get a 6, the woman has a baby. Flip a coin. If it's heads, it's a girl. If it's tails, it's a boy. Complete Chart 1 on the next page to track the births per year and the number of boys and girls. Repeat this simulation for ten years. Note: There are 20 women in these age groups. They are numbered 1 through 20 in the chart. For the purposes of this project, assume all women in these age groups remain capable of having children; keep everyone in their assigned age groups. 2. Assuming the births occur as recorded, and that no one dies, what is the population of your island at the end of the ten-year period? Use Chart 2 to clearly show the population of your island at the end of each year. 3. a. Calculate the theoretical probability and the experimental probability of the births. Show your work. b. Compare the theoretical probability to the experimental probability. c. Discuss any similarities and/or differences. You may consider the annual or gender rates or any other possibility. Gીંના
Probability Island You will collect the data for the population of an island community. Then you will use and evaluate probability models. You will be using this data for the next parts of your project. Your ship is carrying 150 passengers - 75 adult females and 75 adult males - all in good health. An intense storm occurs and your ship hits rocks and wrecks off the coast of a deserted island in the Pacific Ocean. This island has the necessary natural resources for human survival. The ages of your passengers are recorded in the table below. Age Female Male 20-29 10 10 30-39 10 10 40-49 10 10 50-59 15 15 60-69 15 15 70+ 15 15 Total 75 75 Directions: Probability of births 1. For each woman aged 20-39, roll a die one time. If you get a 6, the woman has a baby. Flip a coin. If it's heads, it's a girl. If it's tails, it's a boy. Complete Chart 1 on the next page to track the births per year and the number of boys and girls. Repeat this simulation for ten years. Note: There are 20 women in these age groups. They are numbered 1 through 20 in the chart. For the purposes of this project, assume all women in these age groups remain capable of having children; keep everyone in their assigned age groups. 2. Assuming the births occur as recorded, and that no one dies, what is the population of your island at the end of the ten-year period? Use Chart 2 to clearly show the population of your island at the end of each year. 3. a. Calculate the theoretical probability and the experimental probability of the births. Show your work. b. Compare the theoretical probability to the experimental probability. c. Discuss any similarities and/or differences. You may consider the annual or gender rates or any other possibility. Gીંના

Chapter8: Sequences, Series,and Probability
Section8.7: Probability
Problem 36E: Political Poll An independent polling organization interviewed 100 college students to determine...

Related questions
Question
I have completed the first 2 steps however, I am unsure how to calculate the theoritical
Transcribed Image Text:Probability Island
You will collect the data for the population of an island community. Then you will use
and evaluate probability models. You will be using this data for the next parts of your
project.
all in
Your ship is carrying 150 passengers - 75 adult females and 75 adult males -
good health. An intense storm occurs and your ship hits rocks and wrecks off the coast
of a deserted island in the Pacific Ocean. This island has the necessary natural
resources for human survival.
The ages of your passengers are recorded in the table below.
Age
Female Male
20-29 10
10
30-39 10
10
40-49 10
10
50-59 15
15
60-69 15
15
70+
15
15
Total
75
75
Directions: Probability of births
1. For each woman aged 20-39, roll a die one time. If you get a 6, the woman has a
baby. Flip a coin. If it's heads, it's a girl. If it's tails, it's a boy. Complete Chart 1 on the
next page to track the births per year and the number of boys and girls. Repeat this
simulation for ten years. Note: There are 20 women in these age groups. They are
numbered 1 through 20 in the chart. For the purposes of this project, assume all
women in these age groups remain capable of having children; keep everyone in their
assigned age groups.
2. Assuming the births occur as recorded, and that no one dies, what is the population
of your island at the end of the ten-year period? Use Chart 2 to clearly show the
population of your island at the end of each year.
3. a. Calculate the theoretical probability and the experimental probability of the births.
Show your work.
b. Compare the theoretical probability to the experimental probability.
c. Discuss any similarities and/or differences. You may consider the annual or gender
rates or any other possibility.
Tuesday
Transcribed Image Text:Chart 1.
Woman
1
2
3
4
5
6
7
8
9
10
11
12
13
14
15
X
16
X
G
17
X
B
18
X
B.
-19
G
20
GX
G
Total
1
4
boys
23
Total
2
3
2
girls
Total
3 11
36 46
Births
Chart 2
0
2
3
4
Year
5
6
Male
75
1
7680
Female 75
77 89
Total 150 153 1164
82 85 87
87 90
85 88 90
133
167 173 177 183
Year
1
X
X
X
X
X
X
X
B
G
X
X
X
X
Year
2
X
Year
3
X
B
G 8
X
G
B
G
G
G
X
X
B
G
X
x
X
B
X
X
X
X
Year
4
X
Ğ
G
*
B
X
B
B
8
Year
5
G
X
X
G
X
X
X
B
B
X
2
Year
6
6
B
X
B
X
X
B
X
X
G
Year
7
G
숫
X X
X
G
B
X
X
X
B
X
X
X
X
G
B
Year
8
G
X
G
X
3
3 4
5
G
B
X
X
Year Year
9
10
X
X
X
X
X
B
B
x
x
X
X
23
3 3
5 6
7
8
9
10
100
at 95 197
93 97 100 103 106
188 195 200 206
B
x
B
B
X
B
X
X
X
4 12
3 3
7
Expert Solution
This question has been solved!
Explore an expertly crafted, step-by-step solution for a thorough understanding of key concepts.

This is a popular solution!

Trending now
This is a popular solution!

Step by step
Solved in 3 steps

Recommended textbooks for you

College Algebra
Algebra
ISBN:
9781305115545
Author:
James Stewart, Lothar Redlin, Saleem Watson
Publisher:
Cengage Learning

Algebra and Trigonometry (MindTap Course List)
Algebra
ISBN:
9781305071742
Author:
James Stewart, Lothar Redlin, Saleem Watson
Publisher:
Cengage Learning
College Algebra
Algebra
ISBN:
9781305115545
Author:
James Stewart, Lothar Redlin, Saleem Watson
Publisher:
Cengage Learning
Algebra and Trigonometry (MindTap Course List)
Algebra
ISBN:
9781305071742
Author:
James Stewart, Lothar Redlin, Saleem Watson
Publisher:
Cengage Learning

Algebra & Trigonometry with Analytic Geometry
Algebra
ISBN:
9781133382119
Author:
Swokowski
Publisher:
Cengage