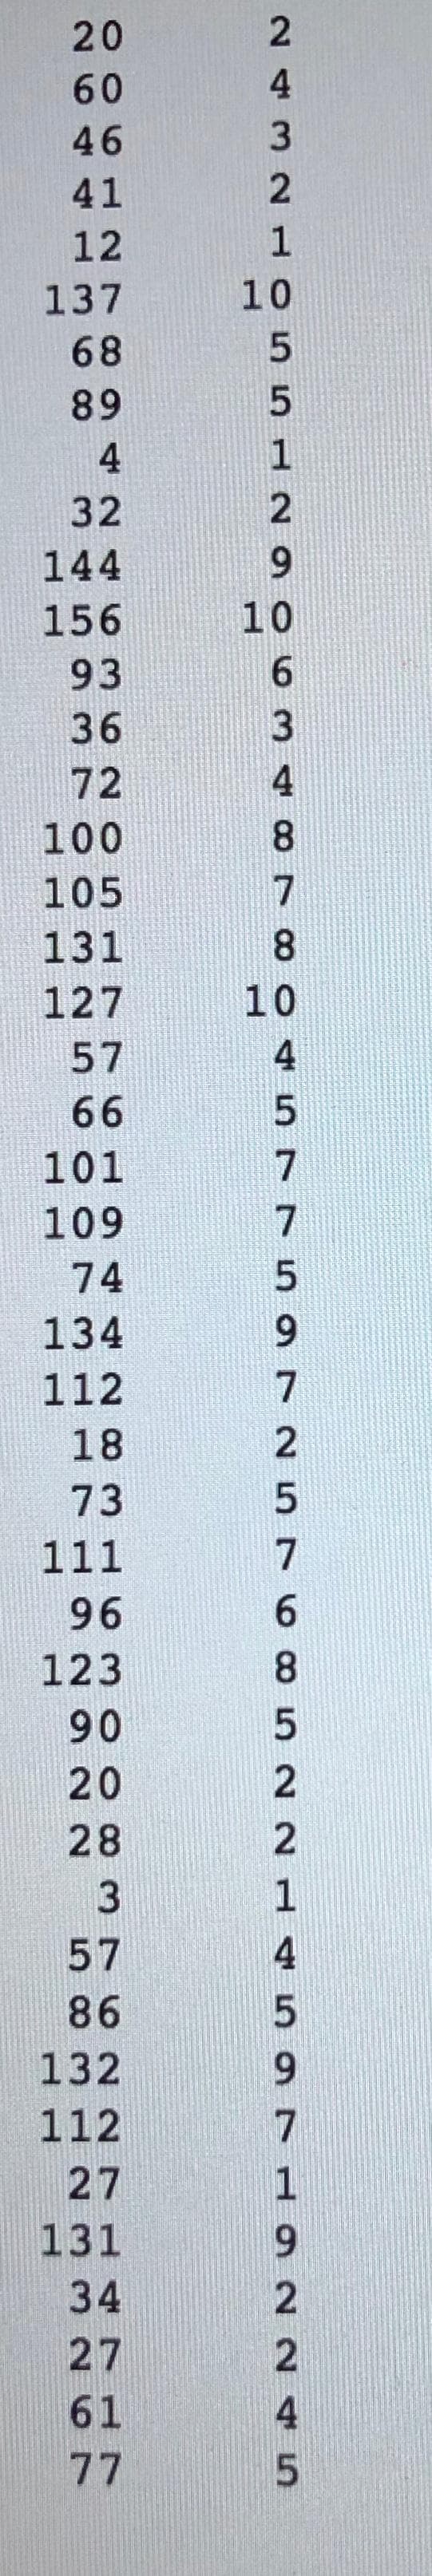
Problem 1. The Tri-City Office Equipment Corporation sells an imported copier on a franchise basis and performs preventative maintenance and repair service on this copier. See the corresponding dataset (on D2L, labelled) collected from 45 recent service calls. X is the number of copiers serviced, and Y is the total amount of minutes spent by the service person. (a) Find the mean and variance of each variable. Clearly label each. (b) Find the five number summaries of each variable. (c) Calculate the linear correlation coefficient. Would you support fitting a line to this data? Why? (d) Find the line of best fit. (e) Does the y-intercept bo have any physical meaning here? Why or why not? (f) What exactly does the slope tell us in the context of this problem? (g) Obtain a point estimate (fitted value) for the expected service time when X 7 copiers are serviced? Is this an appropriate use of our model? 2 20 4 60 3 46 2 41 1 12 10 137 68 5 89 4 2 32 144 10 156 6 93 3 36 4 72 8 100 105 7 131 10 127 57 66 101 109 74 134 112 18 5 73 111 96 123 90 5 20 2 28 3 4 57 86 132 112 7 27 131 34 2 27 61 77 с о иnгrО агN огоФ oN ара Nна NNRN


Minimization
In mathematics, traditional optimization problems are typically expressed in terms of minimization. When we talk about minimizing or maximizing a function, we refer to the maximum and minimum possible values of that function. This can be expressed in terms of global or local range. The definition of minimization in the thesaurus is the process of reducing something to a small amount, value, or position. Minimization (noun) is an instance of belittling or disparagement.
Maxima and Minima
The extreme points of a function are the maximum and the minimum points of the function. A maximum is attained when the function takes the maximum value and a minimum is attained when the function takes the minimum value.
Derivatives
A derivative means a change. Geometrically it can be represented as a line with some steepness. Imagine climbing a mountain which is very steep and 500 meters high. Is it easier to climb? Definitely not! Suppose walking on the road for 500 meters. Which one would be easier? Walking on the road would be much easier than climbing a mountain.
Concavity
In calculus, concavity is a descriptor of mathematics that tells about the shape of the graph. It is the parameter that helps to estimate the maximum and minimum value of any of the functions and the concave nature using the graphical method. We use the first derivative test and second derivative test to understand the concave behavior of the function.
Note here that the Y column (minutes spent) is the first, and the X column (number of copiers serviced) is the second.


Trending now
This is a popular solution!

Step by step
Solved in 5 steps with 3 images


