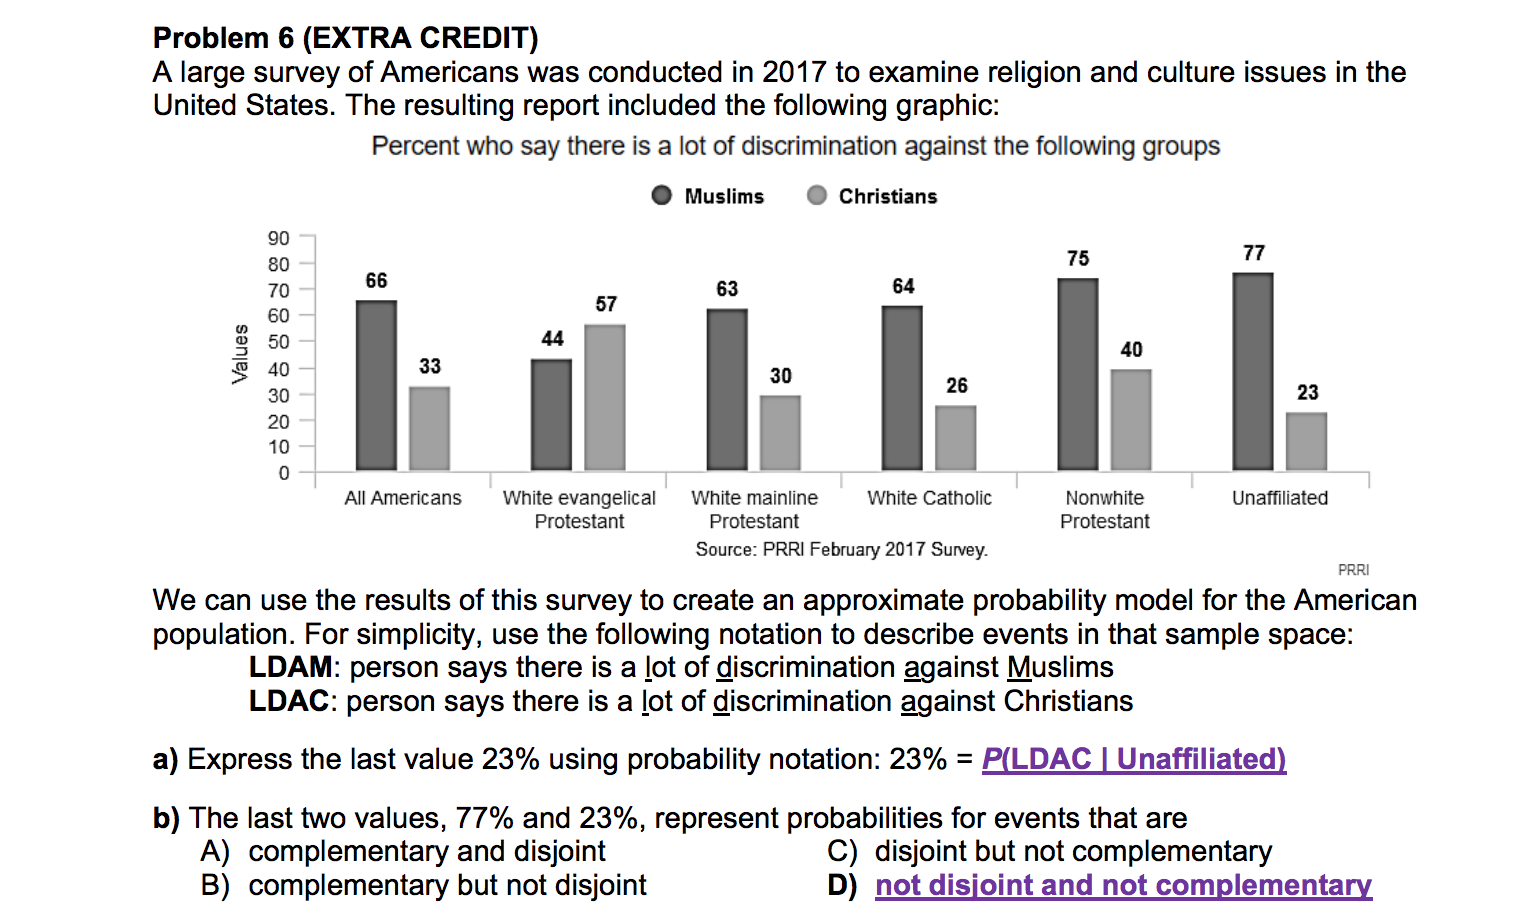
Problem 6 (EXTRA CREDIT) A large survey of Americans was conducted in 2017 to examine religion and culture issues in the United States. The resulting report included the following graphic: Percent who say there is a lot of discrimination against the following groups Muslims Christians 90 77 75 80 66 64 63 70 57 60 44 50 40 33 40 30 26 23 30 20 10 0 White evangelical White Catholic Nonwhite Unaffiliated All Americans White mainline Protestant Protestant Protestant Source: PRRI February 2017 Survey PRR We can use the results of this survey to create an approximate probability model for the American population. For simplicity, use the following notation to describe events in that sample space: LDAM: person says there is a lot of discrimination against Muslims LDAC: person says there is a lot of discrimination against Christians a) Express the last value 23% using probability notation: 23% = P(LDACIUnaffiliated) b) The last two values, 77% and 23%, represent probabilities for events that are A) complementary and disjoint B) complementary but not disjoint C) disjoint but not complementary D) not disioint and not complementary Values


Percentage
A percentage is a number indicated as a fraction of 100. It is a dimensionless number often expressed using the symbol %.
Algebraic Expressions
In mathematics, an algebraic expression consists of constant(s), variable(s), and mathematical operators. It is made up of terms.
Numbers
Numbers are some measures used for counting. They can be compared one with another to know its position in the number line and determine which one is greater or lesser than the other.
Subtraction
Before we begin to understand the subtraction of algebraic expressions, we need to list out a few things that form the basis of algebra.
Addition
Before we begin to understand the addition of algebraic expressions, we need to list out a few things that form the basis of algebra.
can you explain the answer for b? (why it's not disjoint and not complementary)
Also, is "not complementary" same as "independent"?


Trending now
This is a popular solution!

Step by step
Solved in 3 steps


