Problem one (from Farnham, 2014) Suppose the demand and supply curves for a product is given by Q = 500 – 2P Q = -100 + 3P a) Which is the supply curve and why? b) Graph the demand and supply curves. c) Compute the equilibrium price and quantity d) If the current price is 100, what is the quantity demanded and quantity supplied? How would you describe this situation and what would you expect to happen in this market? e) Suppose that the demand changes to Q = 600 – 2P. Find the new equilibrium price and quantity and show this on your graph.
Problem one (from Farnham, 2014) Suppose the demand and supply curves for a product is given by Q = 500 – 2P Q = -100 + 3P a) Which is the supply curve and why? b) Graph the demand and supply curves. c) Compute the equilibrium price and quantity d) If the current price is 100, what is the quantity demanded and quantity supplied? How would you describe this situation and what would you expect to happen in this market? e) Suppose that the demand changes to Q = 600 – 2P. Find the new equilibrium price and quantity and show this on your graph.

Chapter3: Supply And Demand: Theory
Section: Chapter Questions
Problem 1WNG

Related questions
Question
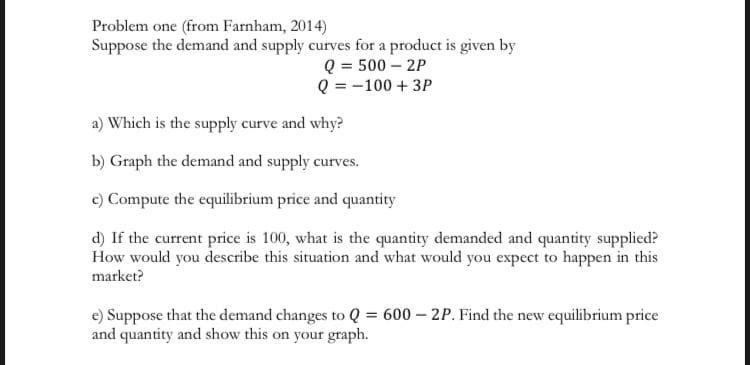
Transcribed Image Text:Problem one (from Farnham, 2014)
Suppose the demand and supply curves for a product is given by
Q = 500 – 2P
Q = -100 + 3P
a) Which is the supply curve and why?
b) Graph the demand and supply curves.
c) Compute the equilibrium price and quantity
d) If the current price is 100, what is the quantity demanded and quantity supplied?
How would you describe this situation and what would you expect to happen in this
market?
e) Suppose that the demand changes to Q = 600 – 2P. Find the new equilibrium price
and quantity and show this on your graph.
Expert Solution
This question has been solved!
Explore an expertly crafted, step-by-step solution for a thorough understanding of key concepts.

This is a popular solution!

Trending now
This is a popular solution!

Step by step
Solved in 2 steps with 1 images

Recommended textbooks for you

Economics (MindTap Course List)
Economics
ISBN:
9781337617383
Author:
Roger A. Arnold
Publisher:
Cengage Learning

Economics (MindTap Course List)
Economics
ISBN:
9781337617383
Author:
Roger A. Arnold
Publisher:
Cengage Learning

Exploring Economics
Economics
ISBN:
9781544336329
Author:
Robert L. Sexton
Publisher:
SAGE Publications, Inc

Managerial Economics: A Problem Solving Approach
Economics
ISBN:
9781337106665
Author:
Luke M. Froeb, Brian T. McCann, Michael R. Ward, Mike Shor
Publisher:
Cengage Learning
