Professor Jennings claims that only 35% of the students at Flora College work while attending school. Dean Renata thinks that the professor has underestimated the number of students with part-time or full-time jobs. A random sample of 84 students shows that 37 have jobs. Do the data indicate that more than 35% of the students have jobs? Use a 5% level of significance. What are we testing in this problem? single proportion single mean (a) What is the level of significance? State the null and alternate hypotheses. Ho: p = 0.35; H1: p + 0.35 Ho: H = 0.35; H1: µ < 0.35 %3D Но: р %3D 0.35; Hi: р> 0.35 Ho: H = 0.35; H1: µ > 0.35 %3D Ho: H = 0.35; H1: µ ± 0.35 %3D Но: р %3D 0.35; Hi: р < 0.35 (b) What sampling distr The standard normal, since np > 5 and nq > 5. ution will you use? What assumptions are you making? The Student's t, since np < 5 and nq < 5. The standard normal, since np < 5 and nq < 5. The Student's t, since np > 5 and ng > 5. What is the value of the sample test statistic? (Round your answer to two decimal places.) (c) Find the P-value. (Round your answer to four decimal places.)
Professor Jennings claims that only 35% of the students at Flora College work while attending school. Dean Renata thinks that the professor has underestimated the number of students with part-time or full-time jobs. A random sample of 84 students shows that 37 have jobs. Do the data indicate that more than 35% of the students have jobs? Use a 5% level of significance. What are we testing in this problem? single proportion single mean (a) What is the level of significance? State the null and alternate hypotheses. Ho: p = 0.35; H1: p + 0.35 Ho: H = 0.35; H1: µ < 0.35 %3D Но: р %3D 0.35; Hi: р> 0.35 Ho: H = 0.35; H1: µ > 0.35 %3D Ho: H = 0.35; H1: µ ± 0.35 %3D Но: р %3D 0.35; Hi: р < 0.35 (b) What sampling distr The standard normal, since np > 5 and nq > 5. ution will you use? What assumptions are you making? The Student's t, since np < 5 and nq < 5. The standard normal, since np < 5 and nq < 5. The Student's t, since np > 5 and ng > 5. What is the value of the sample test statistic? (Round your answer to two decimal places.) (c) Find the P-value. (Round your answer to four decimal places.)

MATLAB: An Introduction with Applications
6th Edition
ISBN:9781119256830
Author:Amos Gilat
Publisher:Amos Gilat
Chapter1: Starting With Matlab
Section: Chapter Questions
Problem 1P

Related questions
Topic Video
Question
100%
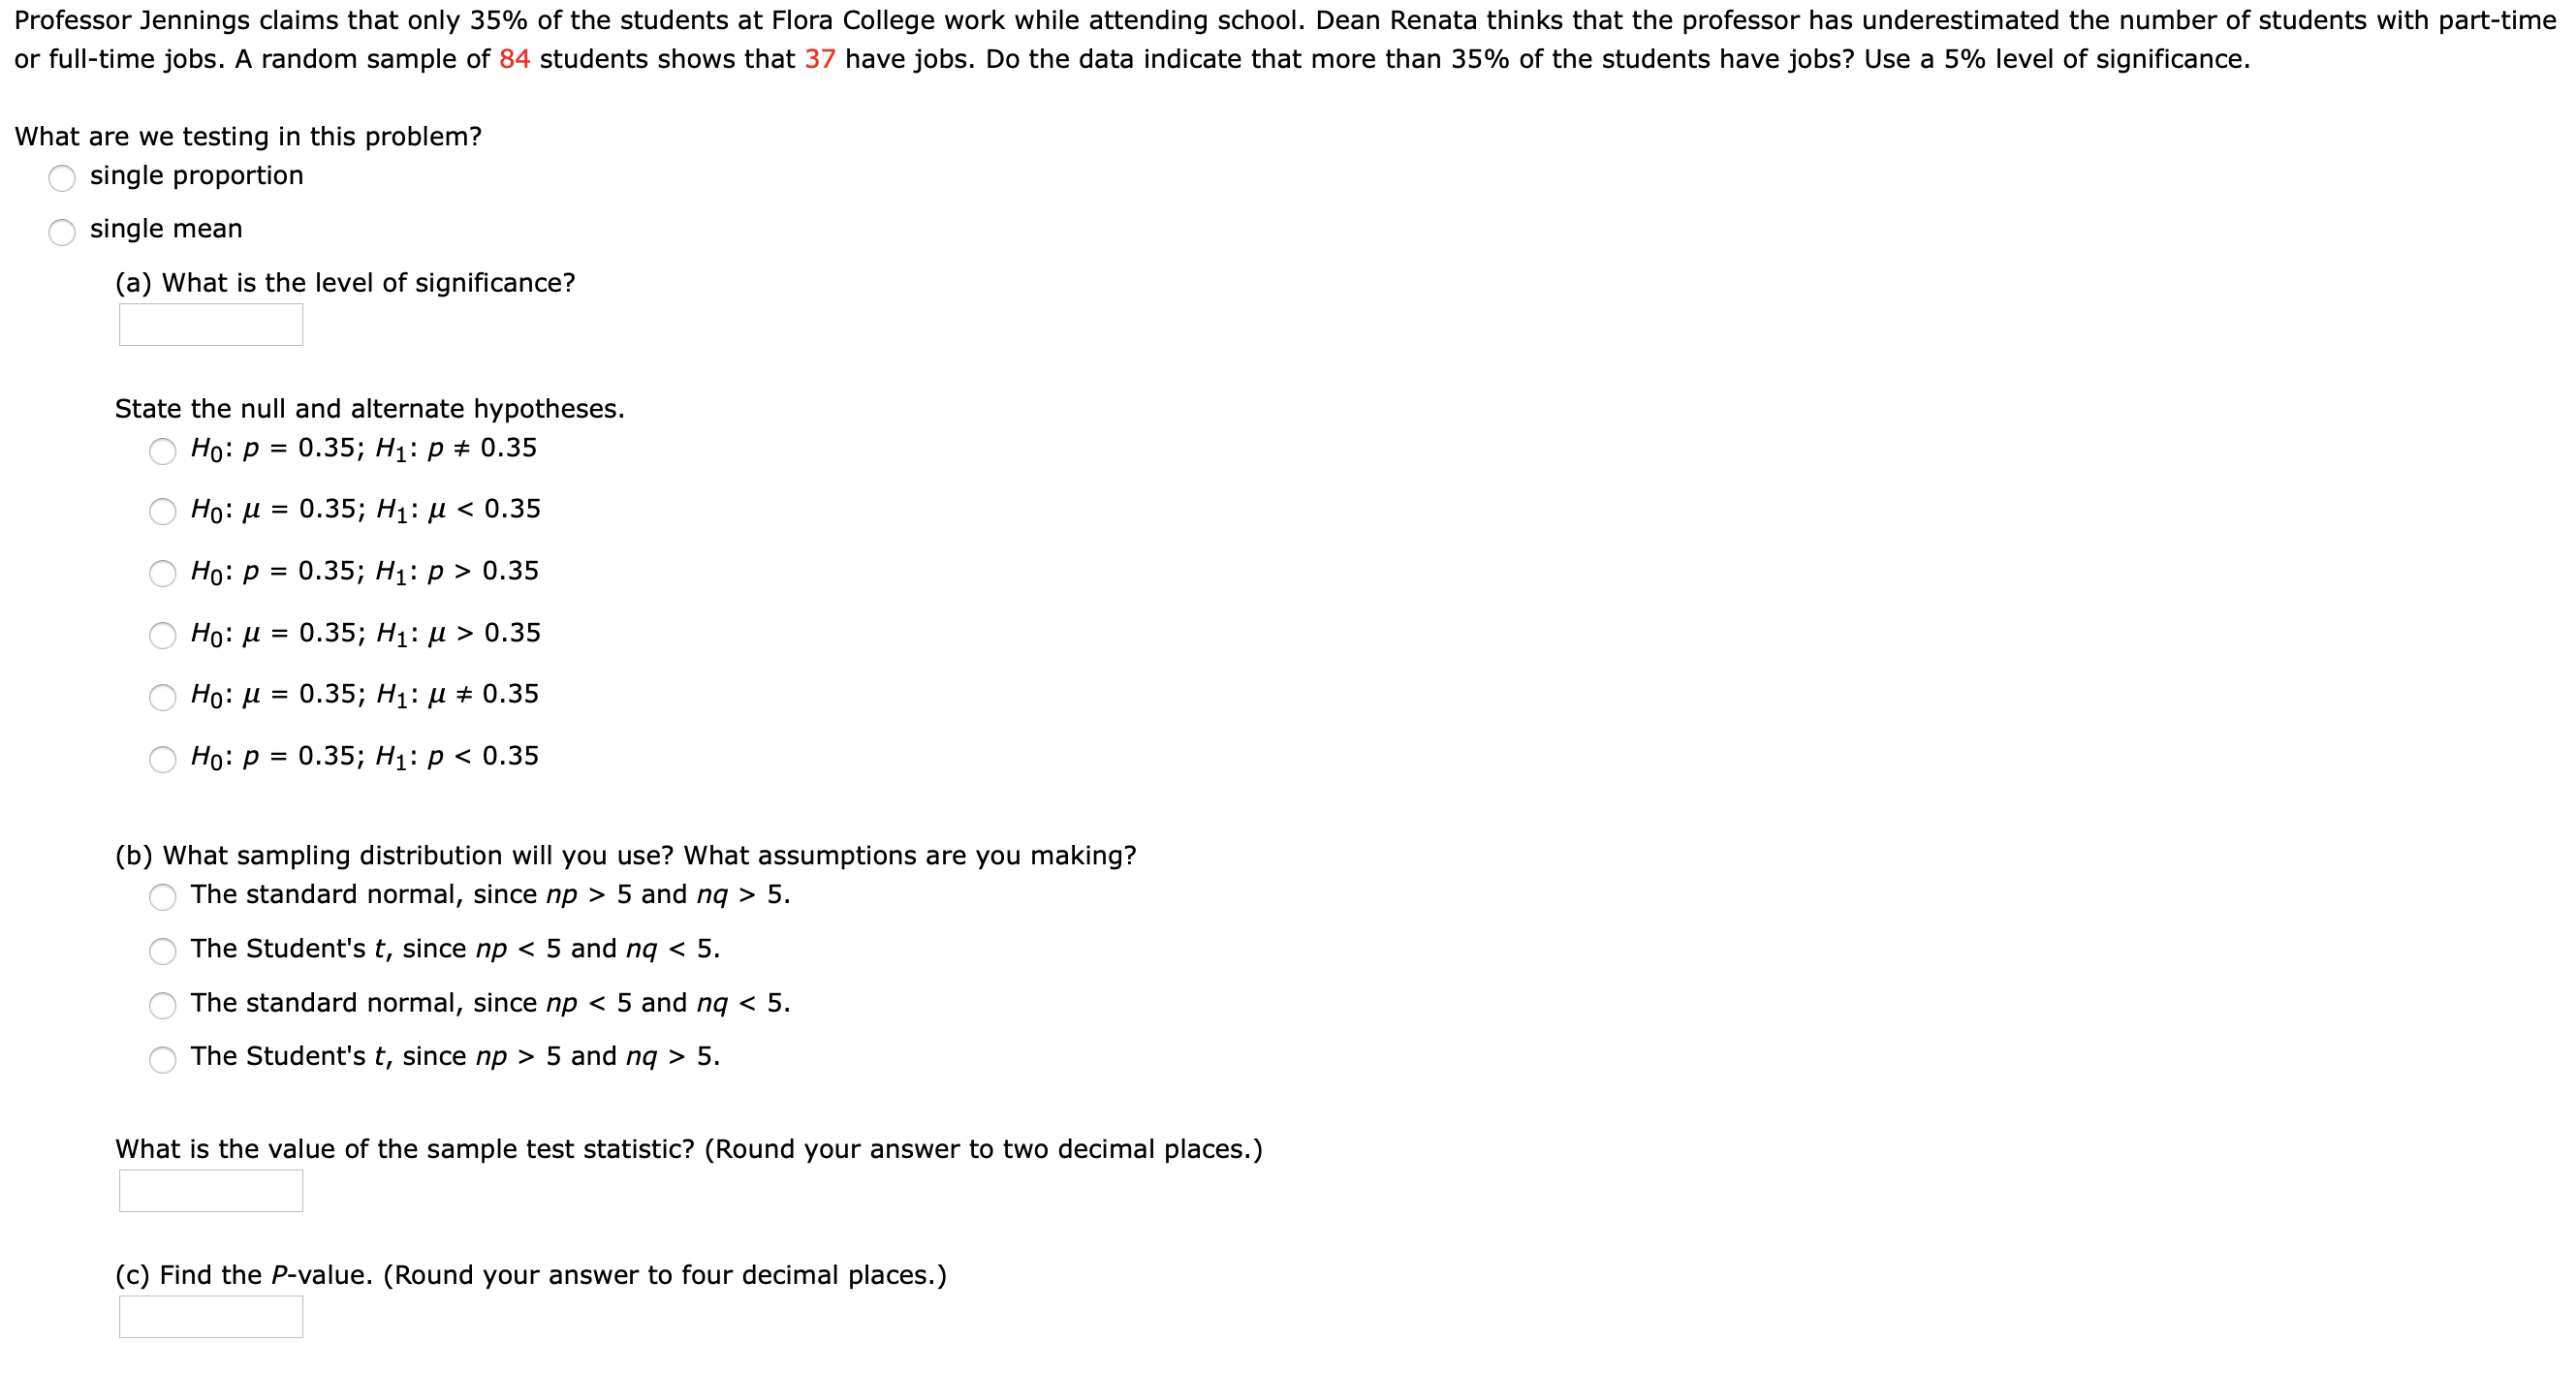
Transcribed Image Text:Professor Jennings claims that only 35% of the students at Flora College work while attending school. Dean Renata thinks that the professor has underestimated the number of students with part-time
or full-time jobs. A random sample of 84 students shows that 37 have jobs. Do the data indicate that more than 35% of the students have jobs? Use a 5% level of significance.
What are we testing in this problem?
single proportion
single mean
(a) What is the level of significance?
State the null and alternate hypotheses.
Ho: p = 0.35; H1: p + 0.35
Ho: H = 0.35; H1: µ < 0.35
%3D
Но: р %3D 0.35; Hi: р> 0.35
Ho: H = 0.35; H1: µ > 0.35
%3D
Ho: H = 0.35; H1: µ ± 0.35
%3D
Но: р %3D 0.35; Hi: р < 0.35
(b) What sampling distr
The standard normal, since np > 5 and nq > 5.
ution will you use? What assumptions are you making?
The Student's t, since np < 5 and nq < 5.
The standard normal, since np < 5 and nq < 5.
The Student's t, since np > 5 and ng > 5.
What is the value of the sample test statistic? (Round your answer to two decimal places.)
(c) Find the P-value. (Round your answer to four decimal places.)

Expert Solution
This question has been solved!
Explore an expertly crafted, step-by-step solution for a thorough understanding of key concepts.

This is a popular solution!

Trending now
This is a popular solution!

Step by step
Solved in 5 steps with 4 images

Knowledge Booster


Learn more about
Need a deep-dive on the concept behind this application? Look no further. Learn more about this topic, statistics and related others by exploring similar questions and additional content below.Recommended textbooks for you
MATLAB: An Introduction with Applications
Statistics
ISBN:
9781119256830
Author:
Amos Gilat
Publisher:
John Wiley & Sons Inc

Probability and Statistics for Engineering and th…
Statistics
ISBN:
9781305251809
Author:
Jay L. Devore
Publisher:
Cengage Learning

Statistics for The Behavioral Sciences (MindTap C…
Statistics
ISBN:
9781305504912
Author:
Frederick J Gravetter, Larry B. Wallnau
Publisher:
Cengage Learning
MATLAB: An Introduction with Applications
Statistics
ISBN:
9781119256830
Author:
Amos Gilat
Publisher:
John Wiley & Sons Inc
Probability and Statistics for Engineering and th…
Statistics
ISBN:
9781305251809
Author:
Jay L. Devore
Publisher:
Cengage Learning
Statistics for The Behavioral Sciences (MindTap C…
Statistics
ISBN:
9781305504912
Author:
Frederick J Gravetter, Larry B. Wallnau
Publisher:
Cengage Learning

Elementary Statistics: Picturing the World (7th E…
Statistics
ISBN:
9780134683416
Author:
Ron Larson, Betsy Farber
Publisher:
PEARSON

The Basic Practice of Statistics
Statistics
ISBN:
9781319042578
Author:
David S. Moore, William I. Notz, Michael A. Fligner
Publisher:
W. H. Freeman

Introduction to the Practice of Statistics
Statistics
ISBN:
9781319013387
Author:
David S. Moore, George P. McCabe, Bruce A. Craig
Publisher:
W. H. Freeman