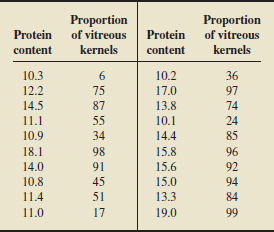
Proportion of vitreous Proportion of vitreous kernels Protein Protein content kernels content 10.3 10.2 36 12.2 75 17.0 97 14.5 87 13.8 74 11.1 55 10.1 24 10.9 34 14.4 85 18.1 98 15.8 96 14.0 91 15.6 92 10.8 45 15.0 94 11.4 51 13.3 84 11.0 17 19.0 99


Correlation
Correlation defines a relationship between two independent variables. It tells the degree to which variables move in relation to each other. When two sets of data are related to each other, there is a correlation between them.
Linear Correlation
A correlation is used to determine the relationships between numerical and categorical variables. In other words, it is an indicator of how things are connected to one another. The correlation analysis is the study of how variables are related.
Regression Analysis
Regression analysis is a statistical method in which it estimates the relationship between a dependent variable and one or more independent variable. In simple terms dependent variable is called as outcome variable and independent variable is called as predictors. Regression analysis is one of the methods to find the trends in data. The independent variable used in Regression analysis is named Predictor variable. It offers data of an associated dependent variable regarding a particular outcome.
Protein Content of Wheat. In their text, Methods of
Protein content is found by expensive chemical analysis,whereas proportion of vitreous kernels is found by visual inspection. To provide an inexpensive way for predicting protein content, we want to obtain an appropriate regression equation for relating protein content to proportion of vitreous kernels.

Step by step
Solved in 2 steps with 2 images


