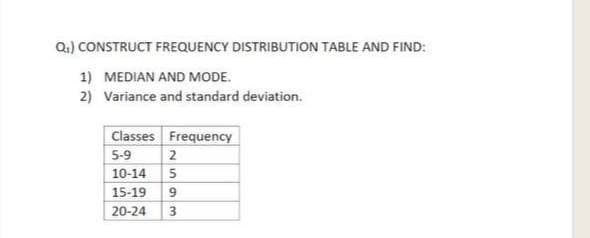
Q.) CONSTRUCT FREQUENCY DISTRIBUTION TABLE AND FIND: 1) MEDIAN AND MODE. 2) Variance and standard deviation. Classes Frequency 5-9 2 10-14 5 15-19 20-24


Q: Twenty-five army inductees were given a blood test to determine their blood type. The data set is A…
A: "Since you have asked multiple questions, we will solve the first question for you. If you want any…
Q: Find the values for n , ∑X, and M for the sample that is summarized in the following frequency…
A: Given table is x f 5 1 4 2 3 3 2 5 1 1 Here n is the total number of X or sum of all…
Q: Sales volume last weekend for a sample of ten car dealerships were as follows: Data Point 1 3 6. 8.…
A: Introduction :- We have to calculate the sample variance.
Q: The data recorded in following Table 4b shows the length of Medical checkup conducted by a Health &…
A: i)Given: The number of classes, k=7. Then, Width=Maximum value-Minimum valuek=1300-37=185.3≃186…
Q: CLASS 6-10 11-15 16-20 21-25 26-30 TOTAL FREQUENCY 7 18 20 17 8 70
A: Given Total frequency 70
Q: The number of daily reading pages for an elementary school student is as follows: 16 17 18 3 7 23 18…
A: a) The frequency class table is Relative Frequency=Frequencytotal frequencyPercentage…
Q: Which of the following is a subset of the population? a Distribution b. Sample c.Data d.Set
A: sample : A finite subset of a population is knownas sample . A sample refers to a smaller,…
Q: * :Determine the Variance for the data in the table below Classes Frequency 4.3-4.39 2 4.4 - 4.49…
A:
Q: Use a calculator to find the variance of this sample data: 194 198 117 107 120 162 151 169 185 139…
A: Use Ti calculator to find the variance as follows: Select STAT > Edit > Enter the values of…
Q: Find the sample variance of the following data points. 6 10 11 15 10 [Keep 2 decimal places rounding…
A: GIVEN DATA POINTS : 6 , 10 , 11 , 15 , 10 TO FIND : VARIANCE OF DATA POINTS = ?
Q: * Draw a Frequency polygon, histogram and a cumu requency distribution for the following data: Class…
A: Frequency Polygon: Excel Procedure: Enter class and frequency in Excel>Select the data in…
Q: Q3. Given the following frequency * ?distribution, What is the mean of the data Frequency 22 15 23…
A: Given : X Frequency 22 15 23 160 24 55 25 15 26 46 Now, the table is obtained to…
Q: Group the data and hence determine A. The sample mean B. The sample median C. The sample mode.
A: Frequency Table Class Count 47-48 5 49-50 8 51-52 18 53-54 5 55-56 2 57-58 3 59-60 1
Q: Data: Student's body weight (kg): 41 60 72 53 72 65 64 48 90 39 38 60 75 48 62 63 49 58 39 72 56 75…
A: For the given data Make frequency distribution table
Q: - Place the following scores in a frequency distribution table. Based on the frequencies, what is…
A: Given Solution:
Q: Prepare a frequency distribution table with a column for intervals and frequencies. Use five…
A: Prepare a frequency distribution table with a column for intervals and frequencies. Use five…
Q: The following frequency distribution shows the score of sample of students in math class Class…
A: We have given that data Median = middle value of the data set.
Q: The data in the table below of Statistics group assignment results (in %) by a random sample of the…
A: “Since you have posted a question with multiple sub-parts, we will solve first three sub-parts for…
Q: Construct a frequency distribution table for the fol- lowing set of scores. Include columns for…
A: Introduction: The frequency distribution for the given scores is to be constructed.
Q: The Highway Patrol, using radar, checked the speeds (in mph) of 30 passing motorists at a…
A: Frequency Distribution: In Statistical theory, a frequency distribution is a tabular, listed or…
Q: Use a calculator to find the variance of this sample data: 170 148 196 164 200 177 134 181 179 186…
A: According to the given information, we have Data set: 170,148,196,164,200,177,134,181,179,186
Q: The speeds of a random sample of 100 cars are recorded as they pass a highway checkpoint. The…
A: There is gap between the classes. So we need to change the classesso that the classes will be…
Q: Consider the observed frequencies. Observed Frequencies () Populations Response 1 3 Yes 150 150 96…
A: From the provided information, Response Populations 1 2 3 Yes 150 150 96…
Q: A. Find the mean, median, mode, Q,, Q,, D, P38, and P7 of each of the following data sets. Make a…
A: Given problem is :
Q: Two samples of scores on a survey are as follows: Sample A: 107 6 87 9 Sample B: 18 310 112 7 24.…
A: For the given sample data A and B Which has more variability? A or B
Q: Use the following data (exam scores) from pre-calculus class to construct a frequency and percentage…
A: From the above data We are given that the observations. 33 42 49 49 53 55 55 61 63 67 68 68 69 69…
Q: The objective of building a frequency distribution is to find a meaningful pattern in the data,…
A: Given data: The objective of building a frequency distribution is to find a meaningful pattern in…
Q: Construct a categorical frequency distribution for the data. Class Frequency Caramel Hazelnut Mocha…
A: It is given that C-caramel, H-Hazelnut, M-Mocha, P-plain and V-Vanilla.
Q: The letter grades in a Statistics course are distributed as follows: Grade A Frequency 24 Grade B…
A: Let oi (i=1,2,...,n) is a set of observed frequencies and ei (i=1,2,...,n) is the corresponding set…
Q: Of the electric bills for a samle of 40 families Electric bill Number of families 2 12-16 14 4-8…
A:
Q: Consider the following frequency distribution. Class Midpoint Frequency 0 – 9 4.5 6 10 – 19 14.5 14…
A:
Q: The covariance of the following sample data of four (X, Y) pairs: (1, 5), (2, 10), (4, 7), and (5,…
A: Calculation: X Y XY 1 5 5 2 10 20 4 7 28 5 2 10 Total 12 24 63 X=1n∑X…
Q: Suppose a distribution has Mean=20, Median=10, and SD=15. Then, the coefficient of skewness is, a)…
A: Given: Mean = 20 Median =10 SD = 15
Q: Find the quartile deviation and mean deviation as well as their co-efficients from the following…
A: Given : 58 59 60 61 62 63 64 65 Group A 10 18 30 42 35 28 16 8 Group B 15 20 32 35 33…
Q: Which of the following percentiles represents the median of a data set? Select one: a. 100th b.…
A: to find which percentile represents the median .
Q: Find the mean,median,and mode for the following frequency distribution table x 5,4,3,2,1,0 f…
A: We have given that, The frequency distribution table : x: 5 4 3 2 1 0 f: 2 5 2 3 0 2…
Q: Find Mean, Median and Mode of the following frequency distribution and comment on the results: Datly…
A: The frequency for a grouped data gives the number of observations lies in each class. The class…
Q: Compute for the mean and variance of the given frequency distribution below: Score Number of…
A: Frequency (f) f⋅x f⋅x2 5 3 15 75 8 5 40 320 10 4 40 400 12 5 60 720 15 3 45 675 ---…
Q: The speeds of a random sample of 100 cars are recorded as they pass a highway checkpoint. The…
A:
Q: Data was collected for fish from the North Atlantic. The length of the fish (in mm) is summarized in…
A:
Q: The distribution of yearly income of people (thousand $) was as follows: Class <31 31-40 41-50 51-60…
A:
Q: 3. The blood types of 25 blood donors are given below. Summarize the data using a frequency…
A: Hi! Thank you for the question, As per the honor code, we are allowed to answer one question at a…
Q: The objective of building a frequency distribution is to find a meaningful pattern in the data,…
A: Frequency Distribution: A frequency distribution is a representation, either in a graphical or…
Q: • B. Develop the frequency histogram and the frequency distribution of the data and determine:Use…
A: First we create class intervals according to given data set. Then we count the frequency for each…
Q: Draw a Frequency polygon, histogram and a cumulative frequency distribution for the following data:…
A:
Q: Q. Using the data given below answer the questions asked. 56 48 47 42 52 58 42 37 68 40 32 46 45 41…
A: solution is as follows,
Q: The following data represent the bachelor degrees of CEO's at area small businesses. Determine (i)…
A: i) Mode is the most frequently observing value in the data set. Since marketing repeats 44 times.…
Q: The speeds of a random sample of 100 cars are recorded as they pass a highway checkpoint. The…
A:
Q: For the given data set 3 4 6 7 4 3 8 11 20 23 25 1 2 4 11 22 19 17 15 10 14 12…
A:

Step by step
Solved in 2 steps with 2 images
