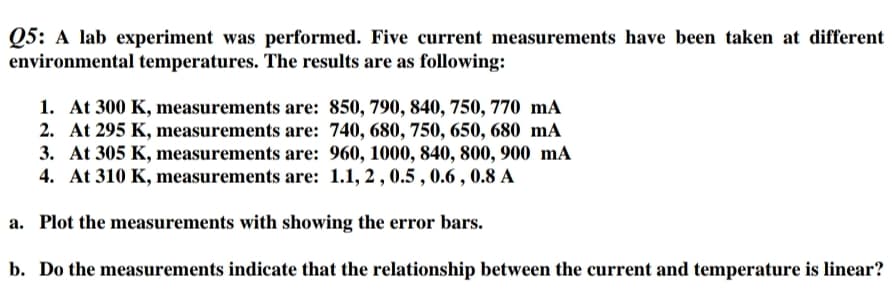
Q5: A lab experiment was performed. Five current measurements have been taken at different environmental temperatures. The results are as following: 1. At 300 K, measurements are: 850, 790, 840, 750, 770 mA 2. At 295 K, measurements are: 740, 680, 750, 650, 680 mA 3. At 305 K, measurements are: 960, 1000, 840, 800, 900 mA 4. At 310 K, measurements are: 1.1, 2, 0.5 , 0.6 , 0.8 A a. Plot the measurements with showing the error bars. b. Do the measurements indicate that the relationship between the current and temperature is linear?


We will use the Matlab to plot the error bars for the given values of the current at the definite temperature, in order to plot this we will require deep learning toolbox added with our Matlab. The data is arranged in increasing order of temperature with size 5.
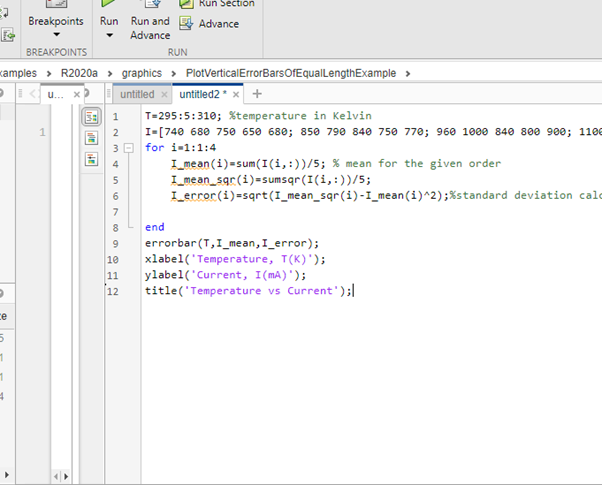
Since the order size of the current is five, we will convert the given values of the current in a similar unit say miliamperes, the script is shown below:
(a)
"
T=295:5:310; %temperature in Kelvin
I=[740 680 750 650 680; 850 790 840 750 770; 960 1000 840 800 900; 1100 2000 500 600 800];%current in miliamperes
for i=1:1:4
I_mean(i)=sum(I(i,:))/5; % mean for the given order
I_mean_sqr(i)=sumsqr(I(i,:))/5;
I_error(i)=sqrt(I_mean_sqr(i)-I_mean(i)^2);%standard deviation calcuation
end
errorbar(T,I_mean,I_error);
xlabel('Temperature, T(K)');
ylabel('Current, I(mA)');
title('Temperature vs Current');
"

Step by step
Solved in 2 steps with 2 images


