Quarterly sales of a local department store over a 4-year period are given below: Quarters Sales (in millions) Quarters Sales (in millions) 2016 QI 500 2018 Q1 560 2016 Q2 490 2018 Q2 580 2016 Q3 570 2018 Q3 630 2016 Q4 750 2018 Q4 720 2017 Q1 480 2019 Q1 540 2017 Q2 500 2019 Q2 590 2017 Q3 2019 Q3 2019 Q4 580 620 2017 Q4 740 790 The data shows sign of seasonality. By computing seasonal indices for each quarter, forecast the sales for each quarter in year 2020, given that the estimated sales in 2020 is $2600 million. Describe the trend component of the dataset.
Quarterly sales of a local department store over a 4-year period are given below: Quarters Sales (in millions) Quarters Sales (in millions) 2016 QI 500 2018 Q1 560 2016 Q2 490 2018 Q2 580 2016 Q3 570 2018 Q3 630 2016 Q4 750 2018 Q4 720 2017 Q1 480 2019 Q1 540 2017 Q2 500 2019 Q2 590 2017 Q3 2019 Q3 2019 Q4 580 620 2017 Q4 740 790 The data shows sign of seasonality. By computing seasonal indices for each quarter, forecast the sales for each quarter in year 2020, given that the estimated sales in 2020 is $2600 million. Describe the trend component of the dataset.

Practical Management Science
6th Edition
ISBN:9781337406659
Author:WINSTON, Wayne L.
Publisher:WINSTON, Wayne L.
Chapter13: Regression And Forecasting Models
Section13.7: Exponential Smoothing Models
Problem 29P: The file P13_29.xlsx contains monthly time series data for total U.S. retail sales of building...

Related questions
Question
Picture
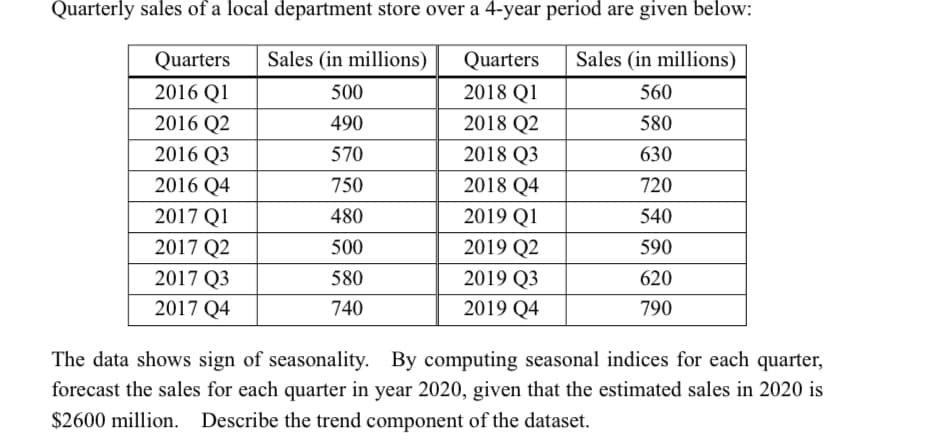
Transcribed Image Text:Quarterly sales of a local department store over a 4-year period are given below:
Quarters
Sales (in millions)
Quarters
Sales (in millions)
2016 QI
500
2018 Q1
560
2016 Q2
490
2018 Q2
580
2016 Q3
570
2018 Q3
630
2016 Q4
750
2018 Q4
720
2017 Q1
480
2019 Q1
540
2017 Q2
500
2019 Q2
590
2017 Q3
2019 Q3
2019 Q4
580
620
2017 Q4
740
790
The data shows sign of seasonality. By computing seasonal indices for each quarter,
forecast the sales for each quarter in year 2020, given that the estimated sales in 2020 is
$2600 million. Describe the trend component of the dataset.
Expert Solution
This question has been solved!
Explore an expertly crafted, step-by-step solution for a thorough understanding of key concepts.

This is a popular solution!

Trending now
This is a popular solution!

Step by step
Solved in 3 steps

Knowledge Booster


Learn more about
Need a deep-dive on the concept behind this application? Look no further. Learn more about this topic, operations-management and related others by exploring similar questions and additional content below.Recommended textbooks for you
Practical Management Science
Operations Management
ISBN:
9781337406659
Author:
WINSTON, Wayne L.
Publisher:
Cengage,
Practical Management Science
Operations Management
ISBN:
9781337406659
Author:
WINSTON, Wayne L.
Publisher:
Cengage,