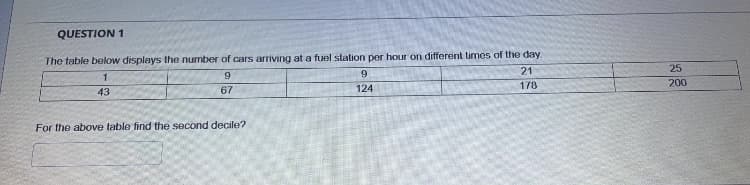
QUESTION 1 The table below displays the number of cars arriving at a fuel station per hour on different times of the day 21 25 9. 9 178 200 43 67 124 For the above table find the second decile?


Q: Question Two It can be said that some professionsljobs come with more stress. This stress is…
A: (i) To find mean: Level of hostility Number of professionals, fi Mid value, xi fixi 0 to 1 4…
Q: Question 2 A student has completed 12 courses in the School of Arts and Sciences. Her grades in the…
A: 1. The frequency corresponding to a particular value in a data set is the count of the number of…
Q: Question 1A Complete the following table by finding cf and C Data (x) Frequency (f)…
A: Frequency distribution table : A statistical distribution table may be a graph that shows the…
Q: Missy Walters owns a mail-order business specializing in clothing, linens, and furniture for…
A: a) Step 1: The lowest value in the data set is 123. The highest value in the data set is 490. Step…
Q: QUESTION 6 The table below displayed the number of tickets sold on different days for a concert…
A:
Q: Suppose you are interested in explaining maximum July temperatures in degrees Fahrenheit and…
A: The value of β1 denotes slope.
Q: Suppose you are interested in explaining maximum July temperatures in degrees Fahrenheit and…
A: In multiple linear regression, there will be more than one independent variable. In simple linear…
Q: Activity 1: Yes, I can! Create an online survey of your section on "The Devices Available at Home…
A: Probability Probability of an event can be calculated by dividing the number of ways an event can…
Q: QUESTION 12 Find the range for the given data. Rich Borne ispurrently taking Chemistry 101. On the…
A: We are given a data. We are asked to find the range of the given data. On the five laboratory…
Q: A greenhouse full of tomato plants is being looked after by a farmer. He measures each of the plants…
A: The frequency of a class or observation is the number of values corresponding to it. The data is…
Q: QUESTION 3 Using the following histogram of waiting times for patients at a health clinic, how many…
A:
Q: Question 9 You are hired to estimate how many people attend a celebration at Alamo Plaza. You mark…
A:
Q: QUESTION 11 The time in seconds, of 15 students running the race are recorded below. Find the time,…
A: Given data is ,40, 44, 45, 58, 60, 62, 64, 67, 67, 69, 71, 75, 77, 78, 78sample size(n)=15the given…
Q: I SOLVE THE FOLLOWING EQUATION 1. The following table shows the number of prescriptions a doctor…
A: Ans is below
Q: Question 12 Data was collected for 40 randomly selected trees growing in the median strip of a busy…
A: Histogram: Histogram is the graphical way of representing the frequency distribution or relative…
Q: Question 11) The table below Displayed the number of tickets sold on different days for a concert…
A:
Q: adults with gum disease were asked the number of times per week they used to floss before their…
A:
Q: QUESTION 4 The figure below shows the histogram of the numeric frequency distribution for shoppers'…
A: Given The histogram shows the number of shoppers corresponding to ages which are tabulated as…
Q: Path: p QUESTION 5 Give the mean of the following list of student heights in inches 62 66 67 70 73
A: 5.From the given information, the student heights are 62, 59, 66, 67, 70 and 73.
Q: Question 6: Answer this. The data below compares the percentage of lessons attended by each student…
A: Box plot is used to measure the spread of the data set. There are three types of box plot, they are…
Q: QUESTION 12 The weight, in kg, of 15 cows are recorded below. Find the weight, in kg,that…
A:
Q: の * 00 T Question 6 The boxplot below shows salaries for Actuaries and CPAS. CPA 20 06 100 110 09…
A: In the box plot first quartile is represented by the left end point of the box and third quartile is…
Q: QUESTION 5 Which of the following can be classified as Discrete and Quantitative data. The number of…
A: Hey there.! thank you for posting your question. Hope you’re doing well. Since you have posted…
Q: Question 14: The dot plot shows the weight of 10 different babies. 5 6 7 9. 10 What is the median of…
A:
Q: QUESTION 11 The table below displayed the number of tickets sold on different days for a concert…
A:
Q: Question 2 In each of the following situations, identify the scale(s) of measurement that is…
A: Since you have posted a question with multiple subparts, we will solve first three subparts for you.…
Q: Question 1 What is the variable type for the type of flooring in a room? O Qualitative Discrete O…
A: Quantitative variable are numeric on nature and divided into two categories discrete and continuous.
Q: QUESTION 9 Given the following data set that presents 30 test scores on an exam, find the median.…
A: GIven data, 49.5, 48, 51, 50, 53.2, 52, 55, 54, 57, 56, 59, 58, 61, 60, 63, 62, 65.4, 64, 67.5, 66,…
Q: QUESTION 7 A nurse measured the blood pressure of each person who visited her clinic. Following is a…
A: We have third class =120 to 130
Q: 3. The following stem-and-leaf plot gives the midterm exam scores for a statistics class. 14 3 4 5…
A: Stem-and-leaf plot:A graphical representation of the quantitative data in which each data entry is…
Q: Create a histogram for each set of data. For the first two problems, the frame is set up for you.…
A: Hello! As you have posted 2 different questions, we are answering the first question. In case you…
Q: QUESTION 1 The table below displayes the number of cars arriving at a fuel station per hour on…
A:
Q: QUESTION 14 If the units of measurement change to larger units, then the correlation: OA. becomes…
A:
Q: QUESTION 12 Find the range for the given data. Rich Borne is currently taking Chemistry 101. On the…
A: Range is the difference between the highest value and the lowest value. Here, the highest value is…
Q: A professor wants to conduct a study in a statistics class to measure the effect of solving problems…
A: It is required to do an F-test on the given data about the response variable and the dependent…
Q: QUESTION 5 The table below displayed the number of tickets sold on different days for a concert…
A:
Q: Question 7 The correlation differs from the covariance in that: A) The correlation describes how…
A: Solution
Q: See below. 4. The following data are the temperatures (in °C) of effluent at discharge from a sewage…
A: The question is about measures Given : To find : 5th and 95th percentile
Q: QUESTION 7 What type of graph would you used to describe the variable "Age"? O A histogram because…
A: Histogram: It is a bar diagram which is suitable for frequency distributions with continuous…
Q: Question 5 The box-and-whisker plot below represents the ages of 12 people. What percent of these…
A: 85 is the answer
Q: QUESTION 7 The table below displayes the number of cars arriving at a fuel station per hour on…
A: To compute: Third decile from the given data.
Q: Question 1 A wedding photographer made $500 on average in the 5 years it has been operational. A…
A: Hey, since there are multiple questions posted, we will answer first question. If you want any…
Q: Question 10 3.1 Question: Which of the following commands calculates the median in Excel? =MEAN…
A: We have to find correct answer from given options
Q: The table below shows the average fuel consumption when driving at a constant speed for the British…
A: Given data : Speed and fuel used We have to tell relationship ( weak or strong) by correlation And…
Q: Dataset for question (4.2.) Amount of Money Spent on Vehicle extras by 7 customer Customer…
A: Customer Amount_spent x1 2300 x2 2386 x3 1920 x4 1578 x5 3065 x6 2312 x7 1790…
Q: QUESTION ONE The data below shows the number of patient visits per week at a doctor’s office. 75 86…
A: As per our guidelines we are suppose to do only one question1.Given data is…
Q: Question 21 quality control analyst wants to build statistical quality control chart for weight of…
A: Introduction :- Here we have to find the lower limit for X- bar chart. Given :- Group size = n =…
Q: QUESTION 8 The table below displays the number of cars arriving at a fuel station per hour on…
A:
Q: QUESTION 17 Determine which type of chart is the most appropriate representation for the following…
A: Solution :-
Q: Answer the following using the data in the attached picture 1. The following data are the score…
A:

Step by step
Solved in 3 steps with 1 images

- question 18 In California, we need more rain to sustain the health of our natural environment, argriculture, and economic. A group of statistics students in Oxnard College recorded the amount of rain during 2016-2017 school year, measuring the intensity by the inches of rain, and the results were: Inches of Rain 1 2 3 4 5 6 Frequency 0 6 2 5 5 7 The mean (¯xx¯) rain intensity: inches (Please show your answer to 1 decimal place.)The median rain intensity: inchesThe mode rain intensity: inches (Please separate your answers by ',' in the bimodal situation. Enter DNE if there is no mode or if there are more than two modes.)Question 2 Classify the data as quantitative or qualitative? a) weights(in pounds) in a Gym class? b) Feedback( on the scale from not satisfied, very satisfied ) survey c) Prices in the restaurant menu?Question #6 The data found below measure the amounts of greenhouse gas emissions from three types of vehicles. The measurements are in tons per year, expressed as CO2 equivalents. Use a 0.05 significance level to test the claim that the different types of vehicle have the same mean amount of greenhouse gas emissions. Based on the results, does the type of vehicle appear to affect the amount of greenhouse gas emissions? View the data Data table Type A Type B Type C 7.8 6.8 8.2 6.8 7.5 9.4 7.8 7.9 9.9 6.6 6.8 8.9 7.8 7.8 8.5 7.7 8.2 9.1 6.2 6.8 8.6 7.7 8.3 8.4 7.6 9.2 6.8 Determine the test statistic. F= ___________ (Round to two decimal places as needed.) Identify the P-value. P-value= _________ (Round to two decimal places as needed.)
- QUESTION 3 130 adults with gum disease were asked the number of times per week they used to floss before their diagnoses. The (incomplete) results are shown below: # of times floss per week Frequency Relative Frequency Cumulative Frequency 0 17 17 1 15 0.1154 2 18 0.1385 50 3 13 0.1 63 4 20 0.1538 83 5 0.1154 98 6 16 0.1231 114 7 16 0.1231 130 a. Complete the table (Use 5 decimal places when applicable) b. What is the cumulative relative frequency for flossing 2 times per week? %2) Assuming that for the height of women, μ = 162.1 cm and σ = 8.8 cm, find the following: a) Pr{Y > 170} b) Pr{Y < 145} c) Pr{165< Y < 179} Refer to problem (2). Give the following percentiles: a) 97.7 b) 50 c) 33 d) 67 Please only solve the bolded problem! Thank you!QUESTION 20 A researcher wants to determine the sensitivity of mammograms to determine how effective they are at diagnosing women who have breast cancer. Assume the researcher obtained the above results from a study, calculate and interpret the sensitivity of mammograms for detecting breast cancer. Frequency of Breast Cancer Cases Frequency of Non-Cancer Cases Frequency of Individuals Who Screened Positive 17 5 Frequency of Individuals Who Screened Negative 8 77 A total of 66.67% of individuals who have breast cancer test positive for breast cancer when using a mammogram as the primary diagnostic test for breast cancer. A total of 68% of individuals who have breast cancer test positive for breast cancer when using a mammogram as the primary diagnostic test for breast cancer. A total of 70.59% of individuals who have breast cancer test positive for breast cancer when using a mammogram as the primary diagnostic test for breast cancer. A…
- QUESTION 13 What is the t-value associated with 15 degrees of freedom and 10% in the tail? (please round your answer to 3 decimal places)One of the steps involved in the processing of corn flakes for cereals involves toasting the flakes. The accompanying table contains data for corn flakes thickness in millimeters for four different toasting times in seconds. 11.1.7-T 20 Sec 40 Sec 60 Sec 80 Sec1.4 1.6 1.9 1.10.8 1.7 1.3 0.70.7 0.8 0.6 0.4Refer to the given table below.Solve for the unknown data from (a) to (j) Please show complete solution.
- Question 2In each of the following situations, identify the scale(s) of measurement that is appropriate for each situation.(i) A visiting school inspector asked a class teacher to rank the thirty students in her class on “level of discipline”, with 1 standing for the least disciplined student and 30 standing for the most disciplined student.(ii) Identical twins living in different environments are being compared to find out the influence of the environment on their academic performance. A standard test on academic performance is giving to fifty (50) sets of identical twins and their performance graded over 100.(iii) “Regular” students and students admitted under the distance learning programme into Accra Institute of Technology are administrated a questionnaire measuring “level of maturity” of the students, with scores on “level of maturity” ranging from 0 to 10.(iv) One thousand students in a statistics class are asked to rate their lecturer on teaching effectiveness at the end of the…Question 6 The tables show critical t values, then positive and negative z scores.Question 10: The work week for adults in the US that work full time is normally distributed with a mean of 47 hours. A newly hired engineer at a start-up company believes that employees at start-up companies work more on average then most working adults in the US. She asks 12 engineering friends at start-ups for the lengths in hours of their work week. Their responses are shown in the table below. Test the claim using a 1% level of significance. Give answer to at least 4 decimal places. Hours 49 46 51 52 50 68 47 52 48 50 55 55 What are the correct hypotheses? H0: hoursH1: hours Based on the hypotheses, find the following:Test Statistic=p-value= The correct decision is to . The correct summary would be: that the mean number of hours of all employees at start-up companies work more than the US mean of 47 hours.

