The numbers of points scored by player A in the fint 12 games of the 2019-2020 NBA regular season are listed 29 15 14 22 22 8 19 6 28 18 19 34 a) Find the mean, median and mode of the data set. Which best represents the center of the data? b) Find the range, variance, and standard deviation of the sample data set e) Find the coeficient of variation of the data set. d) Display the data in a stem-and-leaf plot. Use one line per stem. e) Find the z-score for every value in the sample. 9 List this collection of z-scores to create a new sample. Calculate the new sample mean. Did you get the value you expect? g) What do you expect the new sample standard deviation to be? Do not calculate it
The numbers of points scored by player A in the fint 12 games of the 2019-2020 NBA regular season are listed 29 15 14 22 22 8 19 6 28 18 19 34 a) Find the mean, median and mode of the data set. Which best represents the center of the data? b) Find the range, variance, and standard deviation of the sample data set e) Find the coeficient of variation of the data set. d) Display the data in a stem-and-leaf plot. Use one line per stem. e) Find the z-score for every value in the sample. 9 List this collection of z-scores to create a new sample. Calculate the new sample mean. Did you get the value you expect? g) What do you expect the new sample standard deviation to be? Do not calculate it

Glencoe Algebra 1, Student Edition, 9780079039897, 0079039898, 2018
18th Edition
ISBN:9780079039897
Author:Carter
Publisher:Carter
Chapter10: Statistics
Section10.4: Distributions Of Data
Problem 19PFA

Related questions
Question
parts: d) e) f)
thank you
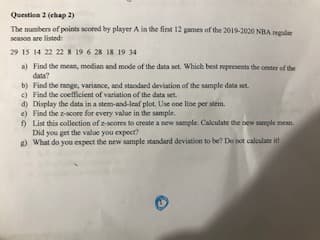
Transcribed Image Text:The numbers of points scored by player A in the fint 12 games of the 2019-2020 NBA regular
season are listed
29 15 14 22 22 8 19 6 28 18 19 34
a) Find the mean, median and mode of the data set. Which best represents the center of the
data?
b) Find the range, variance, and standard deviation of the sample data set
e) Find the coeficient of variation of the data set.
d) Display the data in a stem-and-leaf plot. Use one line per stem.
e) Find the z-score for every value in the sample.
9 List this collection of z-scores to create a new sample. Calculate the new sample mean.
Did you get the value you expect?
g) What do you expect the new sample standard deviation to be? Do not calculate it
Expert Solution
This question has been solved!
Explore an expertly crafted, step-by-step solution for a thorough understanding of key concepts.

This is a popular solution!

Trending now
This is a popular solution!

Step by step
Solved in 3 steps with 6 images

Knowledge Booster


Learn more about
Need a deep-dive on the concept behind this application? Look no further. Learn more about this topic, statistics and related others by exploring similar questions and additional content below.Recommended textbooks for you
Glencoe Algebra 1, Student Edition, 9780079039897…
Algebra
ISBN:
9780079039897
Author:
Carter
Publisher:
McGraw Hill
Glencoe Algebra 1, Student Edition, 9780079039897…
Algebra
ISBN:
9780079039897
Author:
Carter
Publisher:
McGraw Hill