Question 5 A study was carried out to determine the influence of a trace element found in soil on the yield of potato plants grown in that soil, defined as the weight of potatoes produced at the end of the season. A large field was divided up into 14 smaller sections for this experiment. For each section, the experimenter recorded the amount of the trace element found (in milligrams per metre squared) and the corresponding weight of the potatoes produced (in kilograms). This information is presented in the worksheet 'Dataset5' in the Excel document. Define X as the trace element amount and Y as the yield. 1. Draw a scatterplot of your data set. Page 5 2. Set up the framework for an appropriate statistical test to estab- lish if there is a correlation between the amount of the trace ele- ment and the yield. Explain how having the scatterplot referred to above and having the value of r in advance would influence the structure of your statistical test. 3. Calculate the correlation coefficient for the paired data values.
Question 5 A study was carried out to determine the influence of a trace element found in soil on the yield of potato plants grown in that soil, defined as the weight of potatoes produced at the end of the season. A large field was divided up into 14 smaller sections for this experiment. For each section, the experimenter recorded the amount of the trace element found (in milligrams per metre squared) and the corresponding weight of the potatoes produced (in kilograms). This information is presented in the worksheet 'Dataset5' in the Excel document. Define X as the trace element amount and Y as the yield. 1. Draw a scatterplot of your data set. Page 5 2. Set up the framework for an appropriate statistical test to estab- lish if there is a correlation between the amount of the trace ele- ment and the yield. Explain how having the scatterplot referred to above and having the value of r in advance would influence the structure of your statistical test. 3. Calculate the correlation coefficient for the paired data values.

MATLAB: An Introduction with Applications
6th Edition
ISBN:9781119256830
Author:Amos Gilat
Publisher:Amos Gilat
Chapter1: Starting With Matlab
Section: Chapter Questions
Problem 1P

Related questions

Concept explainers
Contingency Table
A contingency table can be defined as the visual representation of the relationship between two or more categorical variables that can be evaluated and registered. It is a categorical version of the scatterplot, which is used to investigate the linear relationship between two variables. A contingency table is indeed a type of frequency distribution table that displays two variables at the same time.
Binomial Distribution
Binomial is an algebraic expression of the sum or the difference of two terms. Before knowing about binomial distribution, we must know about the binomial theorem.
Topic Video
Question
Part 3
Transcribed Image Text:ld influence the structure of your statistical test.
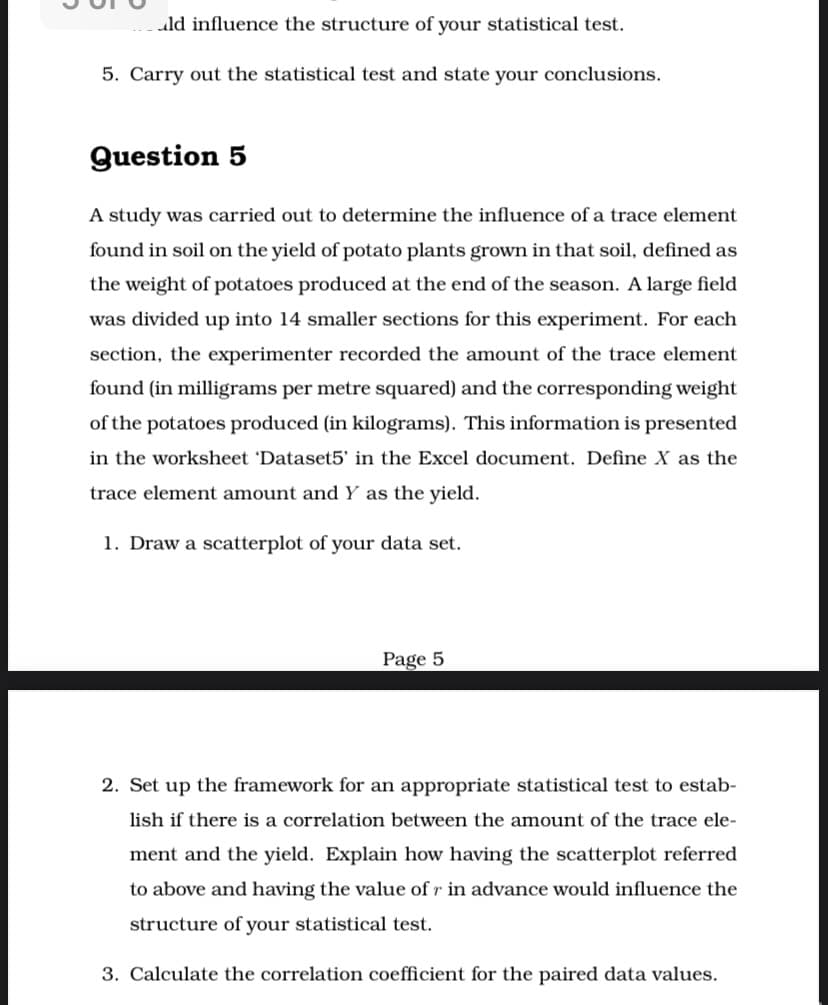
5. Carry out the statistical test and state your conclusions.
Question 5
A study was carried out to determine the influence of a trace element
found in soil on the yield of potato plants grown in that soil, defined as
the weight of potatoes produced at the end of the season. A large field
was divided up into 14 smaller sections for this experiment. For each
section, the experimenter recorded the amount of the trace element
found (in milligrams per metre squared) and the corresponding weight
of the potatoes produced (in kilograms). This information is presented
in the worksheet 'Dataset5' in the Excel document. Define X as the
trace element amount and Y as the yield.
1. Draw a scatterplot of your data set.
Page 5
2. Set up the framework for an appropriate statistical test to estab-
lish if there is a correlation between the amount of the trace ele-
ment and the yield. Explain how having the scatterplot referred
to above and having the value of r in advance would influence the
structure of your statistical test.
3. Calculate the correlation coefficient for the paired data values.
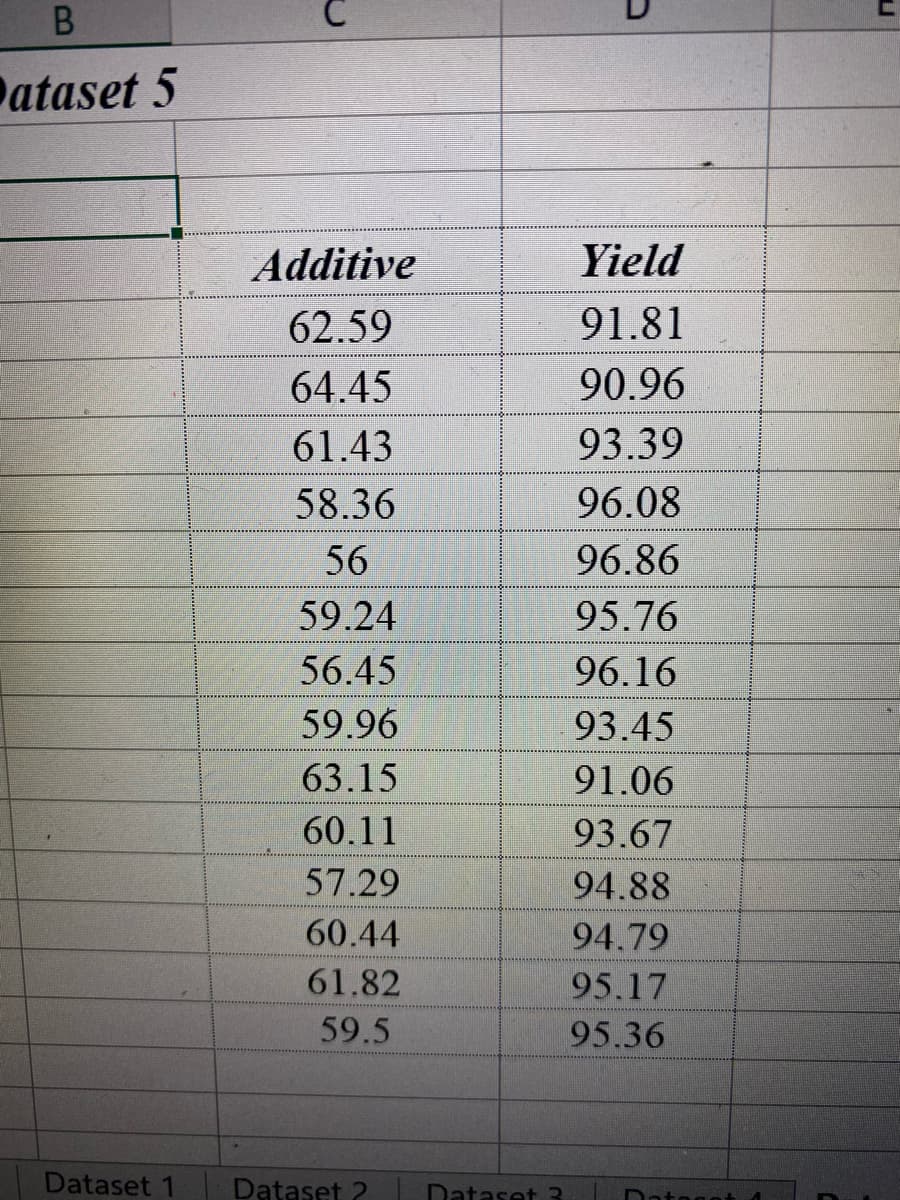
Transcribed Image Text:ataset 5
Additive
Yield
62.59
91.81
64.45
90.96
61.43
93.39
58.36
96.08
56 |
96.86
59.24
95.76
56.45
96.16
59.96
93.45
63.15
91.06
60.11
93.67
57.29
94.88
60.44
94.79
61.82
95.17
59.5
95.36
Dataset 1
Dataset 2
Dataset 3
Data
Expert Solution
This question has been solved!
Explore an expertly crafted, step-by-step solution for a thorough understanding of key concepts.

Step by step
Solved in 3 steps with 1 images

Knowledge Booster


Learn more about
Need a deep-dive on the concept behind this application? Look no further. Learn more about this topic, statistics and related others by exploring similar questions and additional content below.Recommended textbooks for you
MATLAB: An Introduction with Applications
Statistics
ISBN:
9781119256830
Author:
Amos Gilat
Publisher:
John Wiley & Sons Inc

Probability and Statistics for Engineering and th…
Statistics
ISBN:
9781305251809
Author:
Jay L. Devore
Publisher:
Cengage Learning

Statistics for The Behavioral Sciences (MindTap C…
Statistics
ISBN:
9781305504912
Author:
Frederick J Gravetter, Larry B. Wallnau
Publisher:
Cengage Learning
MATLAB: An Introduction with Applications
Statistics
ISBN:
9781119256830
Author:
Amos Gilat
Publisher:
John Wiley & Sons Inc
Probability and Statistics for Engineering and th…
Statistics
ISBN:
9781305251809
Author:
Jay L. Devore
Publisher:
Cengage Learning
Statistics for The Behavioral Sciences (MindTap C…
Statistics
ISBN:
9781305504912
Author:
Frederick J Gravetter, Larry B. Wallnau
Publisher:
Cengage Learning

Elementary Statistics: Picturing the World (7th E…
Statistics
ISBN:
9780134683416
Author:
Ron Larson, Betsy Farber
Publisher:
PEARSON

The Basic Practice of Statistics
Statistics
ISBN:
9781319042578
Author:
David S. Moore, William I. Notz, Michael A. Fligner
Publisher:
W. H. Freeman

Introduction to the Practice of Statistics
Statistics
ISBN:
9781319013387
Author:
David S. Moore, George P. McCabe, Bruce A. Craig
Publisher:
W. H. Freeman