QUESTION 8 The distribution of body size of chiggers (as measured by weight) is known to be log-normal (that is, size is normally distributed if log transformed). The log-transformed mean weight of 11 female and 9 male chiggers are listed in the table below. Female Male Log-transformed Mean Weight (mg) 25.08 25.34 Standard Deviation 2.83 4.97 Solve for the standard error of the difference between two means. Round your answer to 3 decimal places. QUESTION 9 To examine the potential effects on the transmission of dengue. Bian et al. (2010) infected mosquitoes from both the WB1 (laboratory created) strain and the original wild strain with dengue. Fourteen days later, the mosquitoes were allowed to feed on an artificial food solution for 90 minute. Viral titers in the food solution were then measured in plague feeding units per ml. The results are given below. Mosquitoes were tested in groups, and so each data value is an average for the group, measured in plaque feeding units per ml. The data have already been log-transformed using log(Y+1), to better visualize the differences. WB1: n1- 15 R-98 Wild: n2 = 15 R2=8.5 HO: the distribution of viral titers is the same between the two strains HA: the distribution of viral titers is not equal The data has been ranked from smallest to largest and the rank sum (R1. R2) for each data set are listed above. Carry out a Mann-Whitney U-test on the WB1 data. decimal place. solve for U. Answer to one
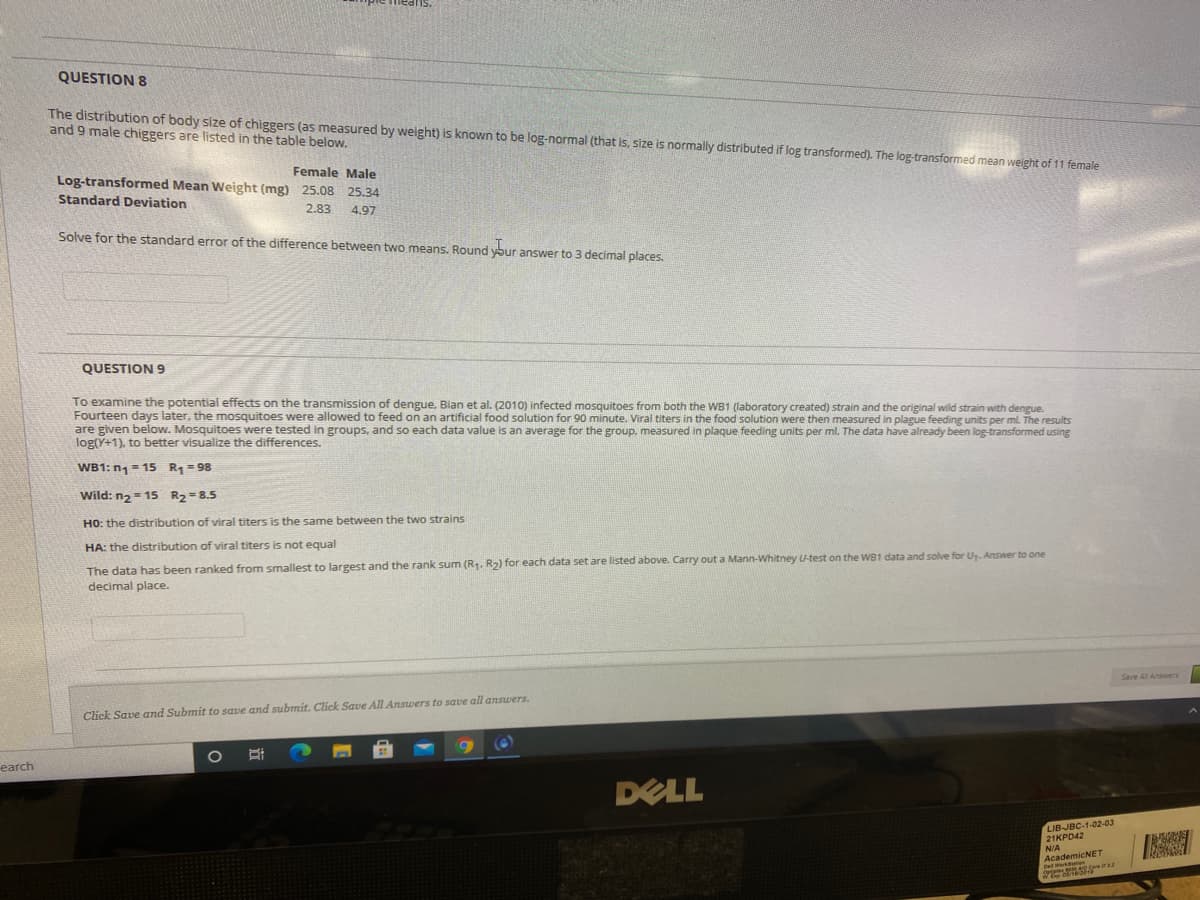
QUESTION 8 The distribution of body size of chiggers (as measured by weight) is known to be log-normal (that is, size is normally distributed if log transformed). The log-transformed mean weight of 11 female and 9 male chiggers are listed in the table below. Female Male Log-transformed Mean Weight (mg) 25.08 25.34 Standard Deviation 2.83 4.97 Solve for the standard error of the difference between two means. Round your answer to 3 decimal places. QUESTION 9 To examine the potential effects on the transmission of dengue. Bian et al. (2010) infected mosquitoes from both the WB1 (laboratory created) strain and the original wild strain with dengue. Fourteen days later, the mosquitoes were allowed to feed on an artificial food solution for 90 minute. Viral titers in the food solution were then measured in plague feeding units per ml. The results are given below. Mosquitoes were tested in groups, and so each data value is an average for the group, measured in plaque feeding units per ml. The data have already been log-transformed using log(Y+1), to better visualize the differences. WB1: n1- 15 R-98 Wild: n2 = 15 R2=8.5 HO: the distribution of viral titers is the same between the two strains HA: the distribution of viral titers is not equal The data has been ranked from smallest to largest and the rank sum (R1. R2) for each data set are listed above. Carry out a Mann-Whitney U-test on the WB1 data. decimal place. solve for U. Answer to one
Chapter6: Exponential And Logarithmic Functions
Section6.8: Fitting Exponential Models To Data
Problem 3TI: Table 6 shows the population, in thousands, of harbor seals in the Wadden Sea over the years 1997 to...
Related questions
Topic Video
Question

Transcribed Image Text:QUESTION 8
The distribution of body size of chiggers (as measured by weight) is known to be log-normal (that is, size is normally distributed if log transformed). The log-transformed mean weight of 11 female
and 9 male chiggers are listed in the table below.
Female Male
Log-transformed Mean Weight (mg) 25.08 25.34
Standard Deviation
2.83
4.97
Solve for the standard error of the difference between two means. Round ybur answer to 3 decimal places.
QUESTION 9
To examine the potential effects on the transmission of dengue, Bian et al. (2010) infected mosquitoes from both the WB1 (laboratory created) strain and the original wild strain with dengue.
Fourteen days later, the mosquitoes were allowed to feed on an artificial food solution for 90 minute. Viral titers in the food solution were then measured in plague feeding units per ml. The results
are given below. Mosquitoes were tested in groups, and so each data value is an average for the group, measured in plaque feeding units per ml. The data have already been log-transformed using
log(Y+1), to better visualize the differences.
WB1: n1 = 15 R= 98
Wild: n2= 15 R2=8.5
HO: the distribution of viral titers is the same between the two strains
HA: the distribution of viral titers is not equal
The data has been ranked from smallest to largest and the rank sum (R. R2) for each data set are listed above. Carry out a Mann-Whitney U-test on the WB1 data and solve for U. Answer to one
decimal place.
Click Save and Submit to save and submit. Click Save All Answers to save all answers.
earch
DELL
LIB-JBC-1-02-03
21KPD42
N/A
AcademicNET
Dell Werks can Ta
Expert Solution
This question has been solved!
Explore an expertly crafted, step-by-step solution for a thorough understanding of key concepts.
This is a popular solution!
Trending now
This is a popular solution!
Step by step
Solved in 2 steps with 1 images

Knowledge Booster
Learn more about
Need a deep-dive on the concept behind this application? Look no further. Learn more about this topic, probability and related others by exploring similar questions and additional content below.Recommended textbooks for you


Algebra & Trigonometry with Analytic Geometry
Algebra
ISBN:
9781133382119
Author:
Swokowski
Publisher:
Cengage

Glencoe Algebra 1, Student Edition, 9780079039897…
Algebra
ISBN:
9780079039897
Author:
Carter
Publisher:
McGraw Hill


Algebra & Trigonometry with Analytic Geometry
Algebra
ISBN:
9781133382119
Author:
Swokowski
Publisher:
Cengage

Glencoe Algebra 1, Student Edition, 9780079039897…
Algebra
ISBN:
9780079039897
Author:
Carter
Publisher:
McGraw Hill