Questions 2-4 are based on the following information: Consider the following population model for household consumption: cons= a Binc+ Bzeduc +B,hhsize + u, where cons is consumption, inc is income, educ is the education level of household head, hhsize is the size of a household. 2. Suppose a researcher estimates the model and gets the predicted value, cons_hat, and then runs a regression of cons_hat on inc, educ, and hhsize. One can a) be certain that the R2 is equal to 1 b) be certain that the R2 is equal to 0 c) be certain that the R2 is less than 1 but greater than 0. d) not be certain 3. Suppose that the variable for consumption is measured with error, so conss = cons + e, where conss is the mismeaured variable, cons is the true variable, e is random, i.e., e independent of all the regressors. We would expect that: a) OLS estimators for the coefficients will all be biased b) OLS estimators for the coefficients will all be unbiased c) all the standard errors will be bigger than they would be without the measurement error
Questions 2-4 are based on the following information: Consider the following population model for household consumption: cons= a Binc+ Bzeduc +B,hhsize + u, where cons is consumption, inc is income, educ is the education level of household head, hhsize is the size of a household. 2. Suppose a researcher estimates the model and gets the predicted value, cons_hat, and then runs a regression of cons_hat on inc, educ, and hhsize. One can a) be certain that the R2 is equal to 1 b) be certain that the R2 is equal to 0 c) be certain that the R2 is less than 1 but greater than 0. d) not be certain 3. Suppose that the variable for consumption is measured with error, so conss = cons + e, where conss is the mismeaured variable, cons is the true variable, e is random, i.e., e independent of all the regressors. We would expect that: a) OLS estimators for the coefficients will all be biased b) OLS estimators for the coefficients will all be unbiased c) all the standard errors will be bigger than they would be without the measurement error

College Algebra
7th Edition
ISBN:9781305115545
Author:James Stewart, Lothar Redlin, Saleem Watson
Publisher:James Stewart, Lothar Redlin, Saleem Watson
Chapter1: Equations And Graphs
Section: Chapter Questions
Problem 10T: Olympic Pole Vault The graph in Figure 7 indicates that in recent years the winning Olympic men’s...

Related questions

Concept explainers
Contingency Table
A contingency table can be defined as the visual representation of the relationship between two or more categorical variables that can be evaluated and registered. It is a categorical version of the scatterplot, which is used to investigate the linear relationship between two variables. A contingency table is indeed a type of frequency distribution table that displays two variables at the same time.
Binomial Distribution
Binomial is an algebraic expression of the sum or the difference of two terms. Before knowing about binomial distribution, we must know about the binomial theorem.
Topic Video
Question
#3
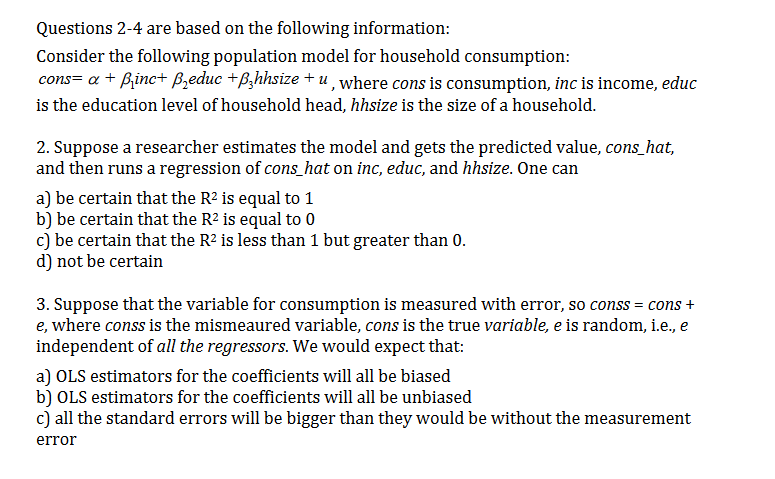
Transcribed Image Text:Questions 2-4 are based on the following information:
Consider the following population model for household consumption:
cons= a Binc+ Bzeduc +B,hhsize + u, where cons is consumption, inc is income, educ
is the education level of household head, hhsize is the size of a household.
2. Suppose a researcher estimates the model and gets the predicted value, cons_hat,
and then runs a regression of cons_hat on inc, educ, and hhsize. One can
a) be certain that the R2 is equal to 1
b) be certain that the R2 is equal to 0
c) be certain that the R2 is less than 1 but greater than 0.
d) not be certain
3. Suppose that the variable for consumption is measured with error, so conss = cons +
e, where conss is the mismeaured variable, cons is the true variable, e is random, i.e., e
independent of all the regressors. We would expect that:
a) OLS estimators for the coefficients will all be biased
b) OLS estimators for the coefficients will all be unbiased
c) all the standard errors will be bigger than they would be without the measurement
error
Expert Solution
This question has been solved!
Explore an expertly crafted, step-by-step solution for a thorough understanding of key concepts.

This is a popular solution!

Trending now
This is a popular solution!

Step by step
Solved in 2 steps

Knowledge Booster


Learn more about
Need a deep-dive on the concept behind this application? Look no further. Learn more about this topic, statistics and related others by exploring similar questions and additional content below.Recommended textbooks for you
College Algebra
Algebra
ISBN:
9781305115545
Author:
James Stewart, Lothar Redlin, Saleem Watson
Publisher:
Cengage Learning

Linear Algebra: A Modern Introduction
Algebra
ISBN:
9781285463247
Author:
David Poole
Publisher:
Cengage Learning
College Algebra
Algebra
ISBN:
9781305115545
Author:
James Stewart, Lothar Redlin, Saleem Watson
Publisher:
Cengage Learning
Linear Algebra: A Modern Introduction
Algebra
ISBN:
9781285463247
Author:
David Poole
Publisher:
Cengage Learning