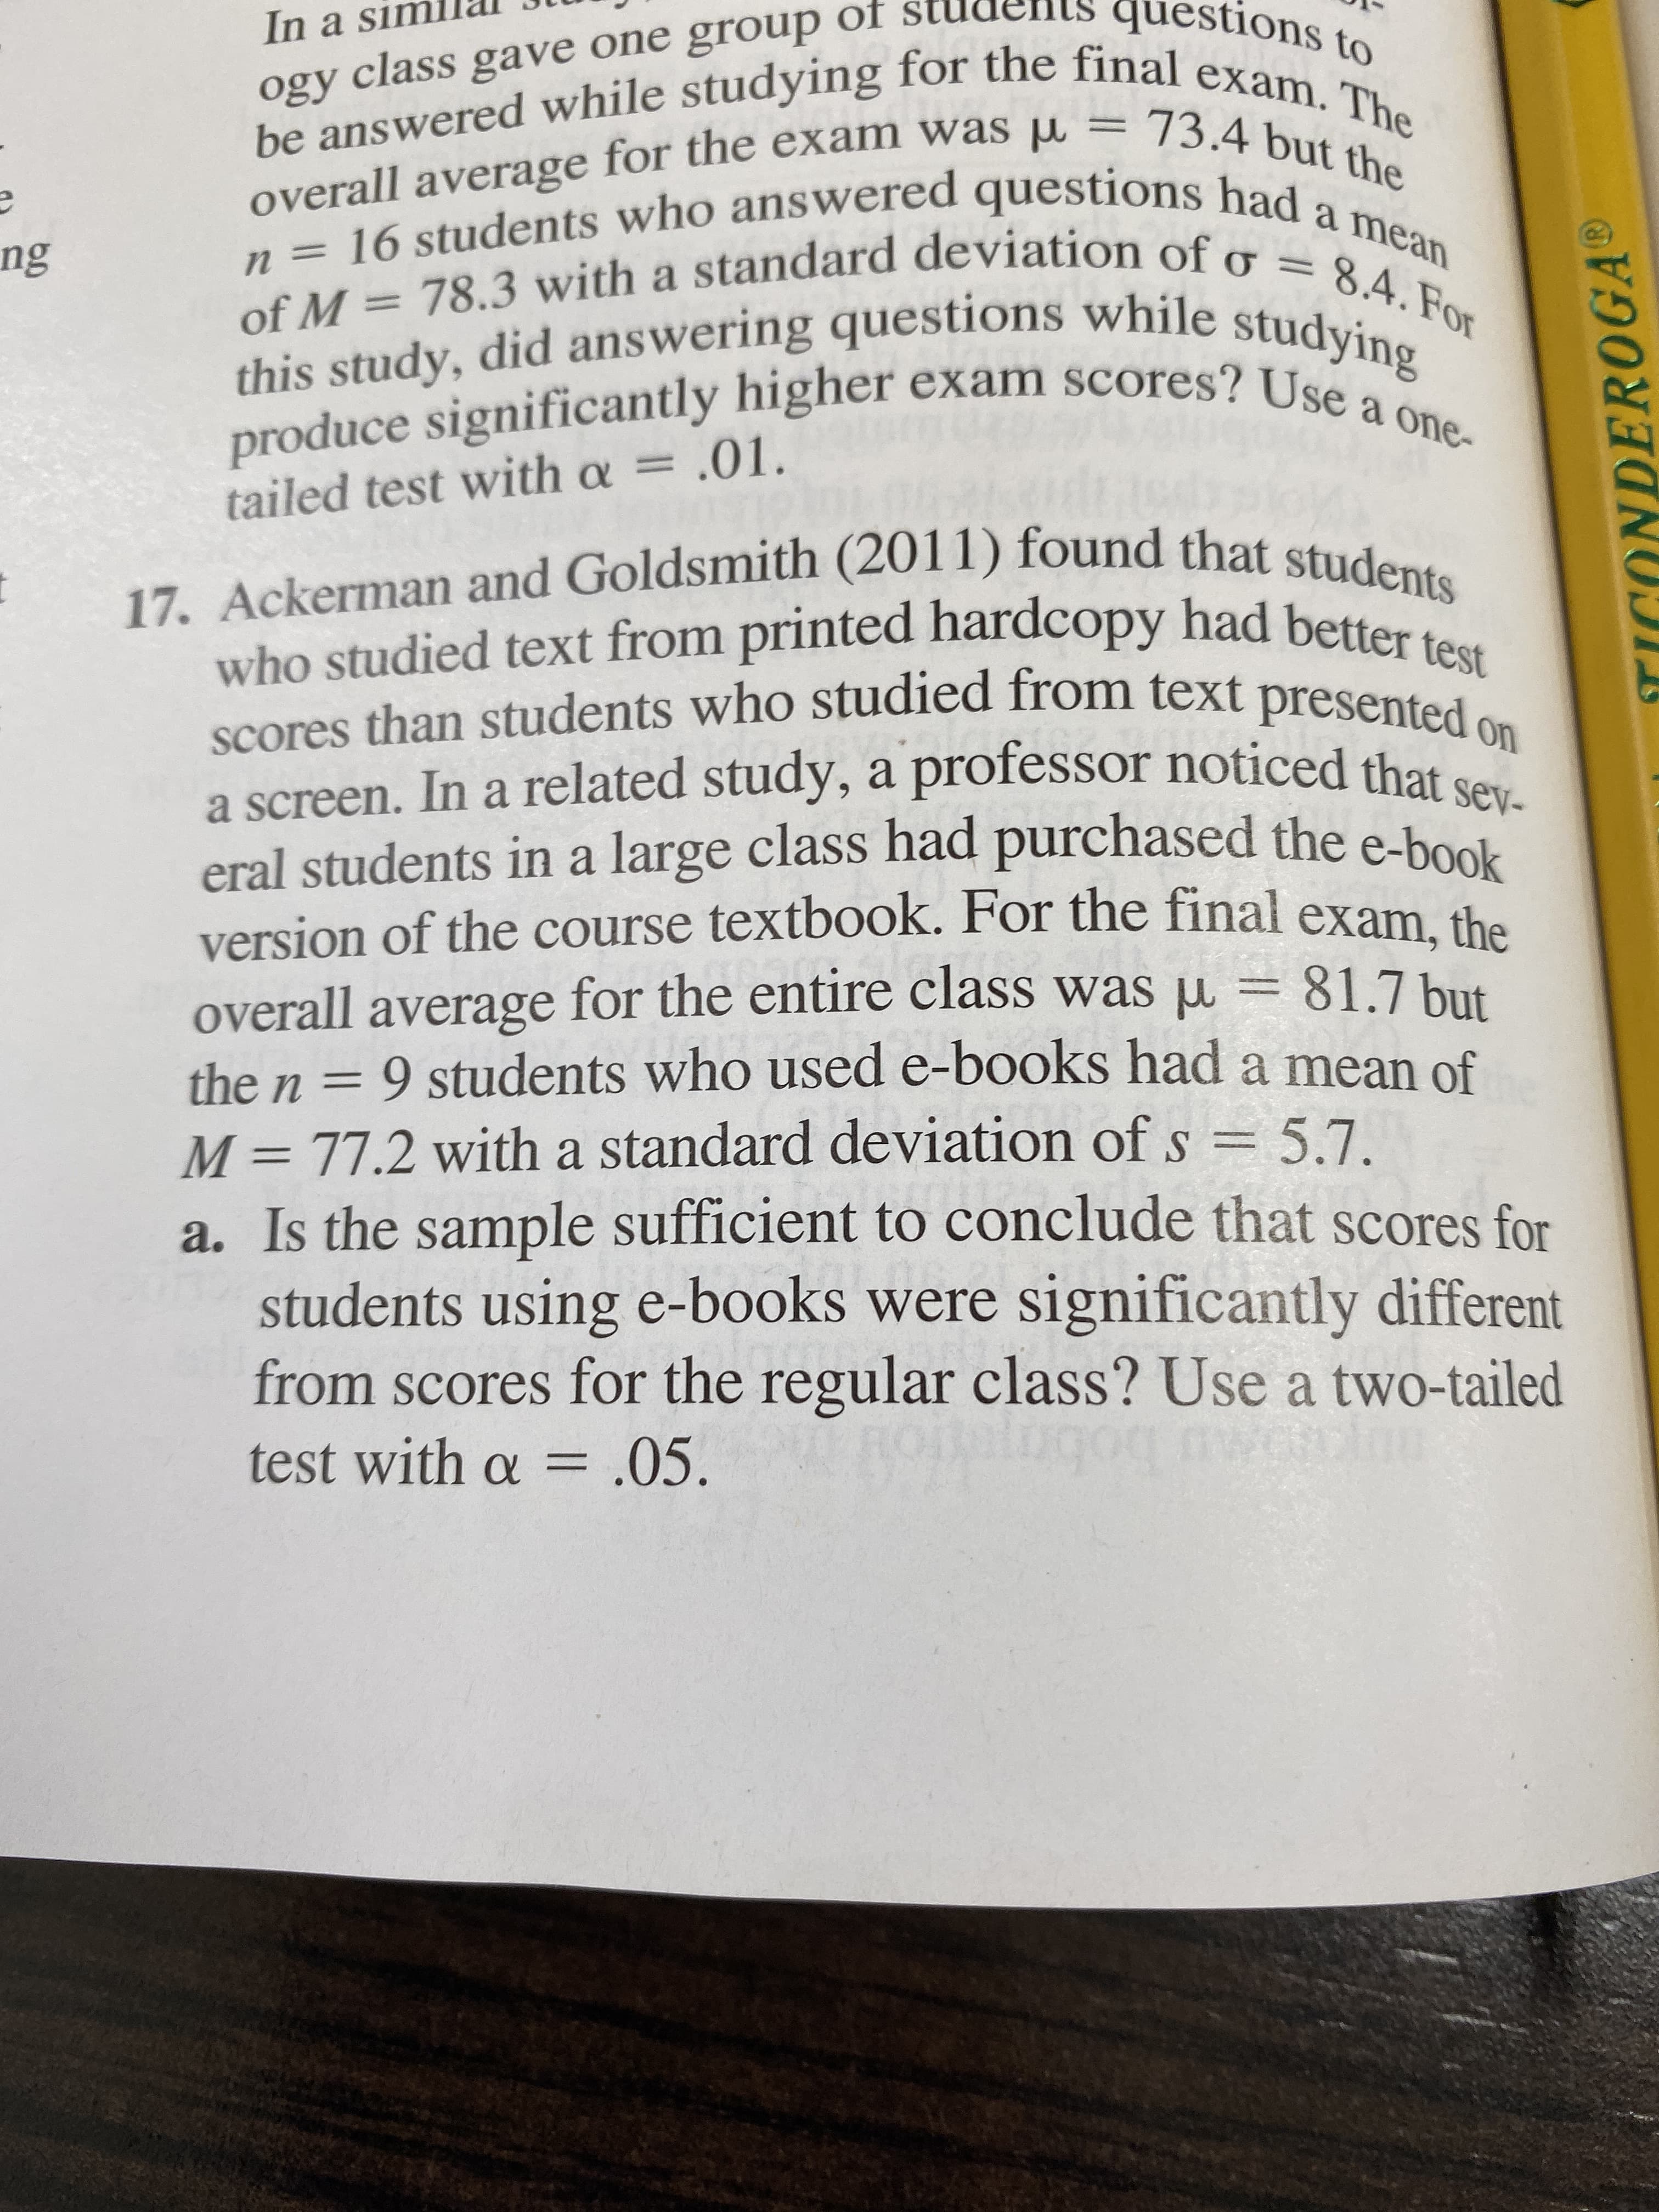
questions to In a sim be answered while studying for the final exam. The overall average for the exam was 73.4 but the n 16 students who answered questions had a mean of M 78.3 with a standard deviation of o = 8.4.For this study, did answering questions while studying produce significantly higher exam scores? Use a one- ogy class gave one group of ng tailed test with a = .01. 17. Ackerman and Goldsmith (2011) found that students who studied text from printed hardcopy had better test presented scores than students who studied from text on a screen. In a related study, a professor noticed that sev- eral students in a large class had purchased the e-book version of the course textbook. For the final exam, the overall average for the entire class was u 81.7 but the n = 9 students who used e-books had a mean of M 77.2 with a standard deviation of s 5.7 a. Is the sample sufficient to conclude that scores for students using e-books were significantly different from scores for the regular class? Use a two-tailed AC g0g test with o = .05. TICONDEROGA h. Construct the 90% confidence interval to estimate the mean exam score if the entire population used dw nobi c. Write a sentence demonstrating how the results from the hypothesis test and the confidence inter- val would appear in a research report. e-books. 18. A random sample of n = 16 scores is obtained from a population with a mean of u = 45. After a treatment Is administered to the individuals in the sample, the sample mean is found to be M = 49.2. nt the camnle standard deviation is d to

Glencoe Algebra 1, Student Edition, 9780079039897, 0079039898, 2018
18th Edition
ISBN:9780079039897
Author:Carter
Publisher:Carter
Chapter10: Statistics
Section10.3: Measures Of Spread
Problem 26PFA
icon
Related questions
icon
Concept explainers
Topic Video
Question

Number 17

questions to
In a sim
be answered while studying for the final exam. The
overall average for the exam was 73.4 but the
n 16 students who answered questions had a mean
of M 78.3 with a standard deviation of o = 8.4.For
this study, did answering questions while studying
produce significantly higher exam scores? Use a one-
ogy class gave one group of
ng
tailed test with a = .01.
17. Ackerman and Goldsmith (2011) found that students
who studied text from printed hardcopy had better test
presented
scores than students who studied from text
on
a screen. In a related study, a professor noticed that sev-
eral students in a large class had purchased the e-book
version of the course textbook. For the final exam, the
overall average for the entire class was u 81.7 but
the n = 9 students who used e-books had a mean of
M 77.2 with a standard deviation of s 5.7
a. Is the sample sufficient to conclude that scores for
students using e-books were significantly different
from scores for the regular class? Use a two-tailed
AC
g0g
test with o = .05.
TICONDEROGA
Transcribed Image Text:questions to In a sim be answered while studying for the final exam. The overall average for the exam was 73.4 but the n 16 students who answered questions had a mean of M 78.3 with a standard deviation of o = 8.4.For this study, did answering questions while studying produce significantly higher exam scores? Use a one- ogy class gave one group of ng tailed test with a = .01. 17. Ackerman and Goldsmith (2011) found that students who studied text from printed hardcopy had better test presented scores than students who studied from text on a screen. In a related study, a professor noticed that sev- eral students in a large class had purchased the e-book version of the course textbook. For the final exam, the overall average for the entire class was u 81.7 but the n = 9 students who used e-books had a mean of M 77.2 with a standard deviation of s 5.7 a. Is the sample sufficient to conclude that scores for students using e-books were significantly different from scores for the regular class? Use a two-tailed AC g0g test with o = .05. TICONDEROGA
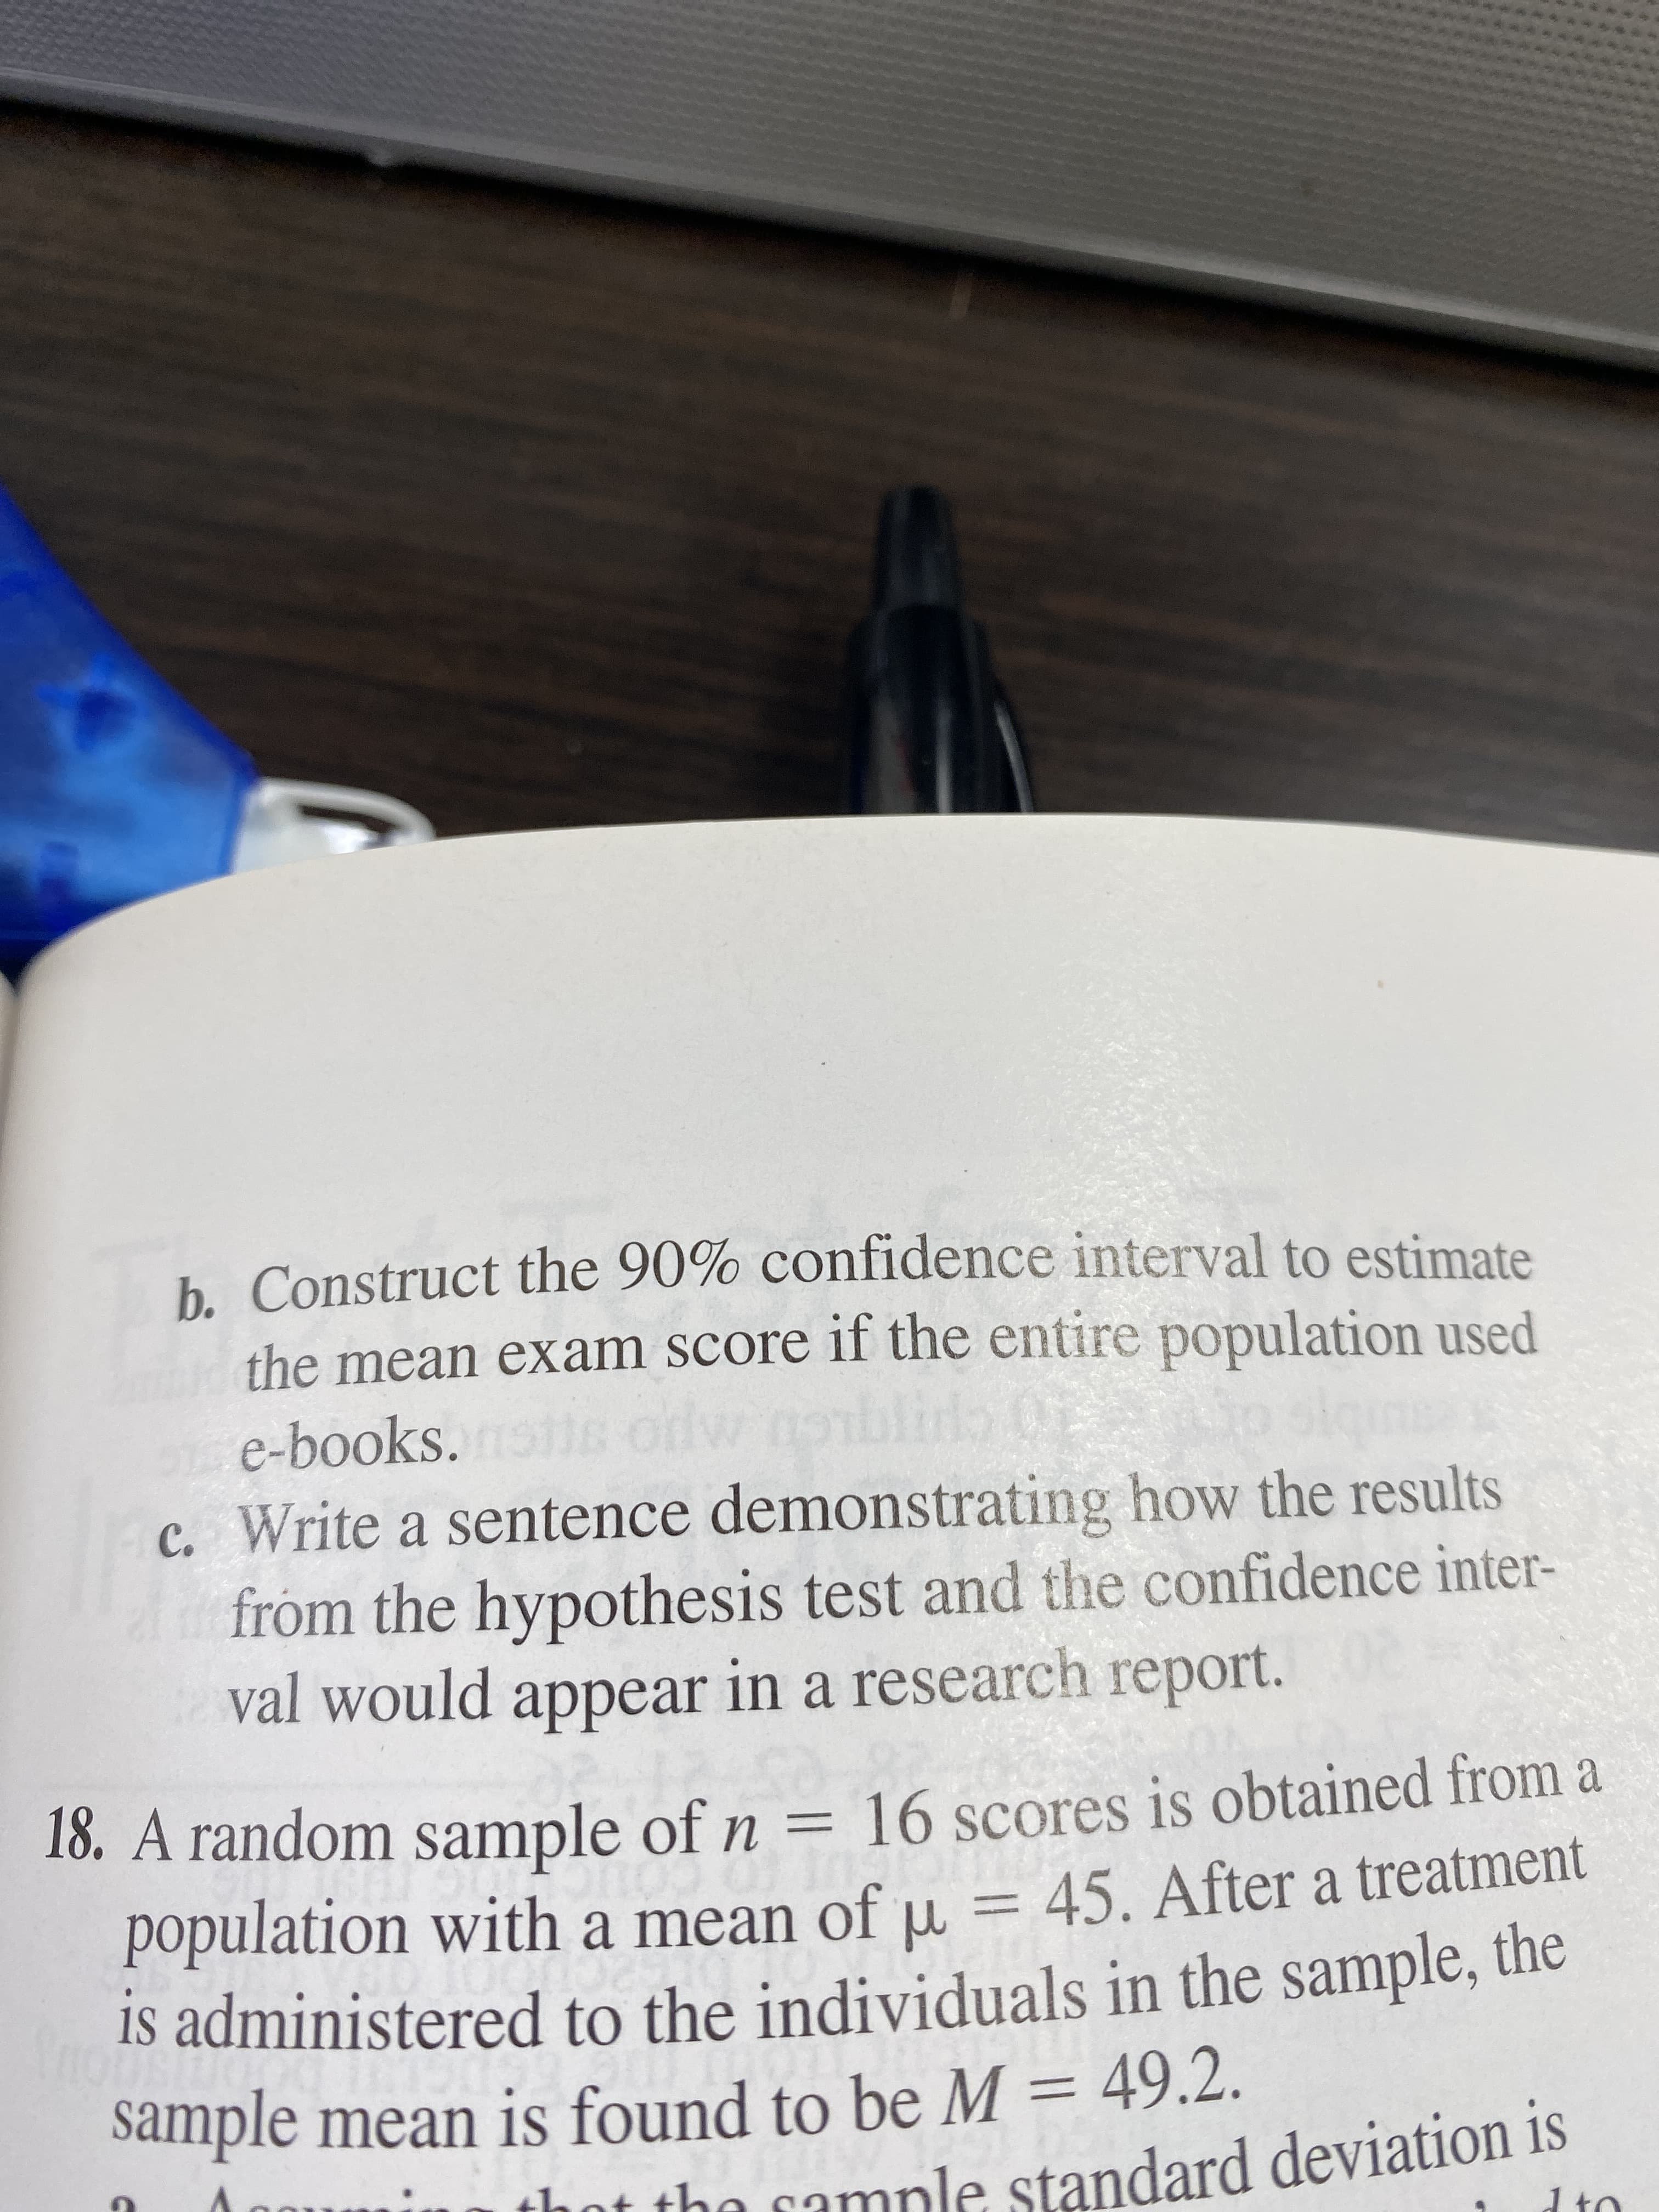
h. Construct the 90% confidence interval to estimate
the mean exam score if the entire population used
dw nobi
c. Write a sentence demonstrating how the results
from the hypothesis test and the confidence inter-
val would appear in a research report.
e-books.
18. A random sample of n = 16 scores is obtained from a
population with a mean of u = 45. After a treatment
Is administered to the individuals in the sample, the
sample mean is found to be M = 49.2.
nt the camnle standard deviation is
d to
Transcribed Image Text:h. Construct the 90% confidence interval to estimate the mean exam score if the entire population used dw nobi c. Write a sentence demonstrating how the results from the hypothesis test and the confidence inter- val would appear in a research report. e-books. 18. A random sample of n = 16 scores is obtained from a population with a mean of u = 45. After a treatment Is administered to the individuals in the sample, the sample mean is found to be M = 49.2. nt the camnle standard deviation is d to
Expert Solution
trending now

Trending now

This is a popular solution!

steps

Step by step

Solved in 3 steps

Blurred answer
Knowledge Booster
Application of Algebra
Learn more about
Need a deep-dive on the concept behind this application? Look no further. Learn more about this topic, statistics and related others by exploring similar questions and additional content below.
Recommended textbooks for you
Glencoe Algebra 1, Student Edition, 9780079039897…
Algebra
ISBN:
9780079039897
Author:
Carter
Publisher:
McGraw Hill