Real-Time Data Analysis Exercise The following table shows the values for real potential GDP and real GDP for the past five years. *Real-time data provided by Federal Reserve Economic Data (FRED), Federal Reserve Bank of Saint Louis. Given this information, calculate the output gap for each year by calculating the percentage difference between real GDP and potential GDP. (Enter your responses as percents rounded to two decimal places. Include a minus sign if necessary.) Year 2018 2019 AVYA 2020 2021 2022 Real Potential GDP ($ billions) 18,788 19,163 19,524 19,865 20,224 Real GDP ($ billions) 18,609 19,036 18,509 19,610 20,015 Output Gap (%)
Real-Time Data Analysis Exercise The following table shows the values for real potential GDP and real GDP for the past five years. *Real-time data provided by Federal Reserve Economic Data (FRED), Federal Reserve Bank of Saint Louis. Given this information, calculate the output gap for each year by calculating the percentage difference between real GDP and potential GDP. (Enter your responses as percents rounded to two decimal places. Include a minus sign if necessary.) Year 2018 2019 AVYA 2020 2021 2022 Real Potential GDP ($ billions) 18,788 19,163 19,524 19,865 20,224 Real GDP ($ billions) 18,609 19,036 18,509 19,610 20,015 Output Gap (%)

Essentials of Economics (MindTap Course List)
8th Edition
ISBN:9781337091992
Author:N. Gregory Mankiw
Publisher:N. Gregory Mankiw
Chapter15: Measuring A Nation's Income
Section: Chapter Questions
Problem 7PA

Related questions
Question
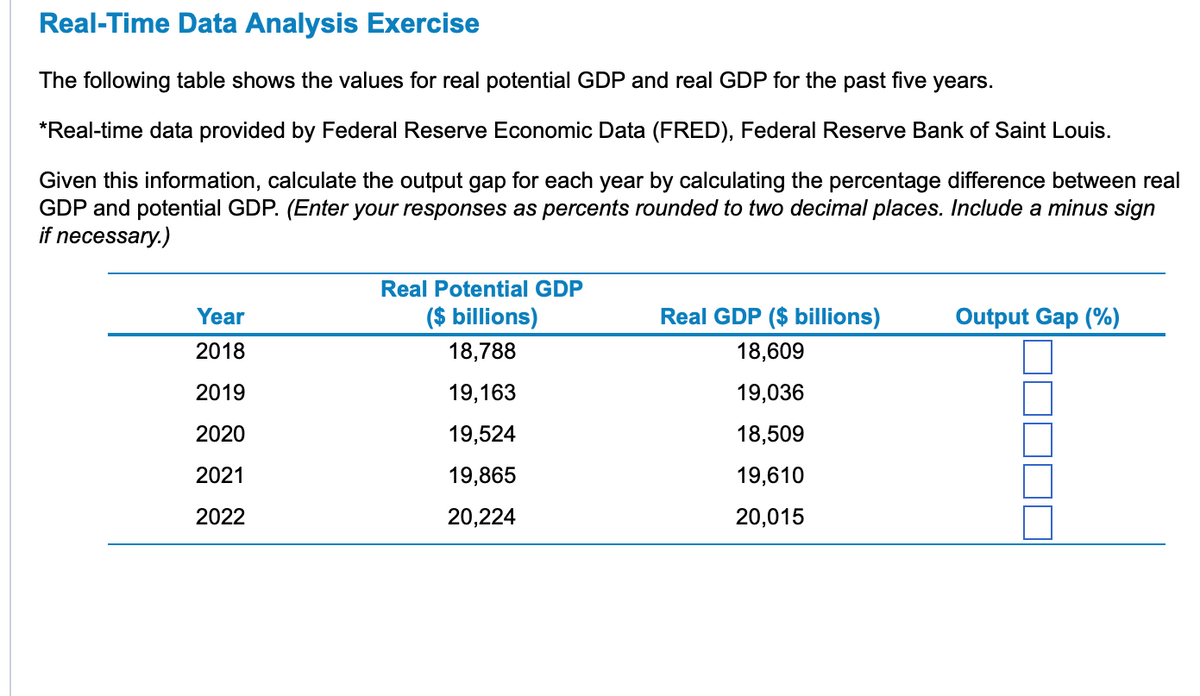
Transcribed Image Text:Real-Time Data Analysis Exercise
The following table shows the values for real potential GDP and real GDP for the past five years.
*Real-time data provided by Federal Reserve Economic Data (FRED), Federal Reserve Bank of Saint Louis.
Given this information, calculate the output gap for each year by calculating the percentage difference between real
GDP and potential GDP. (Enter your responses as percents rounded to two decimal places. Include a minus sign
if necessary.)
Year
2018
2019
2020
2021
2022
Real Potential GDP
($ billions)
18,788
19,163
19,524
19,865
20,224
Real GDP ($ billions)
18,609
19,036
18,509
19,610
20,015
Output Gap (%)
Expert Solution
This question has been solved!
Explore an expertly crafted, step-by-step solution for a thorough understanding of key concepts.

This is a popular solution!

Trending now
This is a popular solution!

Step by step
Solved in 3 steps

Knowledge Booster


Learn more about
Need a deep-dive on the concept behind this application? Look no further. Learn more about this topic, economics and related others by exploring similar questions and additional content below.Recommended textbooks for you
Essentials of Economics (MindTap Course List)
Economics
ISBN:
9781337091992
Author:
N. Gregory Mankiw
Publisher:
Cengage Learning

Brief Principles of Macroeconomics (MindTap Cours…
Economics
ISBN:
9781337091985
Author:
N. Gregory Mankiw
Publisher:
Cengage Learning

Economics: Private and Public Choice (MindTap Cou…
Economics
ISBN:
9781305506725
Author:
James D. Gwartney, Richard L. Stroup, Russell S. Sobel, David A. Macpherson
Publisher:
Cengage Learning
Essentials of Economics (MindTap Course List)
Economics
ISBN:
9781337091992
Author:
N. Gregory Mankiw
Publisher:
Cengage Learning
Brief Principles of Macroeconomics (MindTap Cours…
Economics
ISBN:
9781337091985
Author:
N. Gregory Mankiw
Publisher:
Cengage Learning
Economics: Private and Public Choice (MindTap Cou…
Economics
ISBN:
9781305506725
Author:
James D. Gwartney, Richard L. Stroup, Russell S. Sobel, David A. Macpherson
Publisher:
Cengage Learning

Macroeconomics: Private and Public Choice (MindTa…
Economics
ISBN:
9781305506756
Author:
James D. Gwartney, Richard L. Stroup, Russell S. Sobel, David A. Macpherson
Publisher:
Cengage Learning

