Recall the following definitions from section 6.4 of the text. The area under the normal curve from x = a to x = b with given mean and standard deviation is the probability that x assumes a value between x = a and x = b. If we are using Table IV in Appendix C, we need to standardize the random variable x using the formula z = (x - P)/o, before using the table. Alternatively, you may use a graphing calculator to obtain more accurate calculations without standardizing the random variable x. For example, using a TI83 plus we calculate the area under the normal curve from x = a to x = b by using the normalcdf(a,b,H,0) where u is the mean and o is the standard deviation of the normal distribution. We use 1E99 for o and -1E99 for -o, if needed. Tommy Wait, a minor league baseball pitcher, is notorious for taking an excessive amount of time between pitches. His times between pitches are normally distributed with a mean of 35 seconds and a standard deviation of 1.5 seconds. What percentage of his times between pitches is longer than 37.10 seconds? v Chapter 06, Section 6.3, Intelligent Tutoring Problem 026 Z Your answer is partially correct. Try again. Given that the times between pitches are normally distributed with a mean of 35 seconds and (a) Standardize the data value x = 37.10. standard deviation of 1.5 seconds. 0.0807
Recall the following definitions from section 6.4 of the text. The area under the normal curve from x = a to x = b with given mean and standard deviation is the probability that x assumes a value between x = a and x = b. If we are using Table IV in Appendix C, we need to standardize the random variable x using the formula z = (x - P)/o, before using the table. Alternatively, you may use a graphing calculator to obtain more accurate calculations without standardizing the random variable x. For example, using a TI83 plus we calculate the area under the normal curve from x = a to x = b by using the normalcdf(a,b,H,0) where u is the mean and o is the standard deviation of the normal distribution. We use 1E99 for o and -1E99 for -o, if needed. Tommy Wait, a minor league baseball pitcher, is notorious for taking an excessive amount of time between pitches. His times between pitches are normally distributed with a mean of 35 seconds and a standard deviation of 1.5 seconds. What percentage of his times between pitches is longer than 37.10 seconds? v Chapter 06, Section 6.3, Intelligent Tutoring Problem 026 Z Your answer is partially correct. Try again. Given that the times between pitches are normally distributed with a mean of 35 seconds and (a) Standardize the data value x = 37.10. standard deviation of 1.5 seconds. 0.0807

MATLAB: An Introduction with Applications
6th Edition
ISBN:9781119256830
Author:Amos Gilat
Publisher:Amos Gilat
Chapter1: Starting With Matlab
Section: Chapter Questions
Problem 1P

Related questions
Question
Transcribed Image Text:Recall the following definitions from section 6.4 of the text.
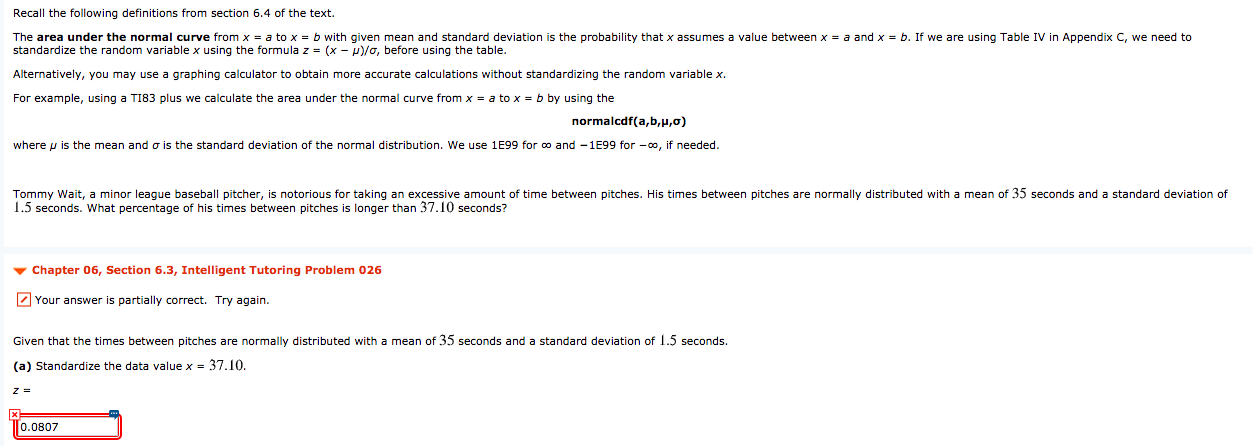
The area under the normal curve from x = a to x = b with given mean and standard deviation is the probability that x assumes a value between x = a and x = b. If we are using Table IV in Appendix C, we need to
standardize the random variable x using the formula z = (x - P)/o, before using the table.
Alternatively, you may use a graphing calculator to obtain more accurate calculations without standardizing the random variable x.
For example, using a TI83 plus we calculate the area under the normal curve from x = a to x = b by using the
normalcdf(a,b,H,0)
where u is the mean and o is the standard deviation of the normal distribution. We use 1E99 for o and -1E99 for -o, if needed.
Tommy Wait, a minor league baseball pitcher, is notorious for taking an excessive amount of time between pitches. His times between pitches are normally distributed with a mean of 35 seconds and a standard deviation of
1.5 seconds. What percentage of his times between pitches is longer than 37.10 seconds?
v Chapter 06, Section 6.3, Intelligent Tutoring Problem 026
Z Your answer is partially correct. Try again.
Given that the times between pitches are normally distributed with a mean of 35 seconds and
(a) Standardize the data value x = 37.10.
standard deviation of 1.5 seconds.
0.0807
Expert Solution
This question has been solved!
Explore an expertly crafted, step-by-step solution for a thorough understanding of key concepts.

This is a popular solution!

Trending now
This is a popular solution!

Step by step
Solved in 2 steps with 2 images

Recommended textbooks for you
MATLAB: An Introduction with Applications
Statistics
ISBN:
9781119256830
Author:
Amos Gilat
Publisher:
John Wiley & Sons Inc

Probability and Statistics for Engineering and th…
Statistics
ISBN:
9781305251809
Author:
Jay L. Devore
Publisher:
Cengage Learning

Statistics for The Behavioral Sciences (MindTap C…
Statistics
ISBN:
9781305504912
Author:
Frederick J Gravetter, Larry B. Wallnau
Publisher:
Cengage Learning
MATLAB: An Introduction with Applications
Statistics
ISBN:
9781119256830
Author:
Amos Gilat
Publisher:
John Wiley & Sons Inc
Probability and Statistics for Engineering and th…
Statistics
ISBN:
9781305251809
Author:
Jay L. Devore
Publisher:
Cengage Learning
Statistics for The Behavioral Sciences (MindTap C…
Statistics
ISBN:
9781305504912
Author:
Frederick J Gravetter, Larry B. Wallnau
Publisher:
Cengage Learning

Elementary Statistics: Picturing the World (7th E…
Statistics
ISBN:
9780134683416
Author:
Ron Larson, Betsy Farber
Publisher:
PEARSON

The Basic Practice of Statistics
Statistics
ISBN:
9781319042578
Author:
David S. Moore, William I. Notz, Michael A. Fligner
Publisher:
W. H. Freeman

Introduction to the Practice of Statistics
Statistics
ISBN:
9781319013387
Author:
David S. Moore, George P. McCabe, Bruce A. Craig
Publisher:
W. H. Freeman