Refer Excel Output and answer the following questions. 1. State multiple regression equation 2. Interpret the meaning of two slopes in this equation 3. Interpret the meaning of adjusted r^2.


Q: What is the value of the intercept for the regression equation?
A:
Q: A researcher is interested in determining whether there is a relationship between height of students…
A: As per our guidelines, we are allowed to answer first three sub-parts only. Thanks Given : X =…
Q: Find the equation of the regression line
A: Lemon Imports (x) : 230,260,365,467,550 Crash Fatality rate(y): 16, 15.9,15.7,15.4,15.1 Total…
Q: Suppose that a regression equation for the relationship between y = weight (pounds) and x = height…
A: We have to find given data.
Q: at point does the regression line
A: the value of constant = α = 3.413 the constant is the value of the dependent variable when the…
Q: Is this statement true "In a nonlinear regression, the slope of the population regression function…
A: From the given information, Consider, non linear regression is as follows: Y =α +βx2 Now slope of…
Q: What is the equation of the regression line?
A: The sums are, x y x2 xy 12 80 144 960 16 41 256 656 20 67 400 1340 21 51 441 1071 23 49…
Q: In a simple linear regression you are told that the estimate of the slope coefficient was 0.9 and…
A: The general formula for the test statistic for slope is, t=b1Sb1
Q: The same researcher wants to know if perception of stress (X) predicts a person's frustration level…
A: Regression is a statistical method used in finance, investing, and other disciplines that attempts…
Q: 4) Use the regression equation to predict the price of a 2000 square foot house in North Salinas.
A: From the above question 4 The independent variable X is Square feet And Dependent variable Y is…
Q: Explain the concept of Slopes and Elasticities for Nonlinear Regression Functions?
A: From the given information, Consider, nonlinear regression function is- Y = ALα Kβ Now, slope and…
Q: #a. Interpret b1 and b2 in this estimated regression equation (to 4 decimals).
A:
Q: Use your linear regression model for the cost data to estimate the variable cost per treadmill.…
A:
Q: 1. Use the computer output to write the estimated regression equation for predicting birth weight…
A: Since you have posted a question with multiple sub-parts, we will solve the first three subparts for…
Q: The regression line always gives an exact model for data. true or false
A: Regression line gives the relationship between the dependent variables and independent variable.
Q: The estimated regression equation to predict sales based on advertising is
A: Use the Excel and Perform the Regression. Followings are the Steps to perform the Regression 1) Open…
Q: Find the regression model for the data given
A: The objective is to determine the regression model for the given data.
Q: Researchers predicted that anxiety is a major factor for adolescent depression. A study was…
A: Given : From given output the equation of regression line is : y=β0+β1xWhere,y=depression (dependent…
Q: Respond to the following questions about Linear Regression. How would you interpret the slope…
A: Slope 1. It is the heart and soul of the regression equation 2. it tells you how much you can…
Q: a) Use the equation of the regression line to predict the score for someone who has consumed 4…
A: The regression equation is given by y = -0.9 x + 8.7 Where x is number of ounces of alcohol…
Q: Write the multiple regression equation for miles per gallon as the response variable. Use weight and…
A: A regression equation models the dependent relationship of two or more variables. It is a measure of…
Q: The personnel director for Electronics Associates developed the following estimated regression…
A: (i). Here -8.69 is the coefficient of length of service, interpretation of this coefficient is that…
Q: a.Fit a multiplelinear regression model for this data.
A: S NO y x1 x2 x3 x4 x5 x6 x7 x8 x9 x10 x11 1 18.9 350 165 260 8 2.56 4 3 200.3 69.9 3910 A 2 20…
Q: if an estimated regression line has a y-intercept of 10 and a slope of -4, then when x=2, what is…
A: It is given that, An estimated regression line has y-intercept ,a= 10 Slope,b=-4 Thus,The estimated…
Q: In 2004, the Texas Bureau of Economic Geology published a study on the economic impact of using…
A: consider that the table representing the approximate number of jobs (in millions) created at various…
Q: Find the equation of the regression line for the given data. Round values to the thousandth
A: Solution: Number of counts (n) = 10 x y xy x2 -5 11 -55 25 -3 6 -18 9 4 -6 -24 16…
Q: in general, how violations of each of the linear regression model assumptions will affect the…
A: It is an important part of statistics . It is widely used .
Q: Define the different ways to use linear regression?
A: Type of regressions is given below: Simple linear regression model Multiple linear regression…
Q: Explain what a dummy variable is and how it is used in regression analysis
A:
Q: Write the multiple regression equation for miles per gallon as the response variable. How might the…
A: Regression: The functional relationship of dependent variable with one or more independent variables…
Q: What are some ideas for practice problems that use the regression equation?
A: Regression Equation is one of the most commonly used techniques in statistics. It is used to…
Q: Define the assumptions of multiple regression and specify which aspects of the analysis require…
A: Note: Hey there! Thank you for the question. We have stated the assumptions for you. We have…
Q: Identify one use of a regression equation.
A:
Q: Respond to the following questions about Linear Regression. a.What is the equation for linear…
A: 2) 1) A linear regression line has an equation of the form Y=a+bx , where X is the explanatory…
Q: A regression between foot length (response variable in cm) and height (explanatory variable in…
A: Thanks for giving opportunity to serve for bartleby students, Hey, There ! Thank you for posting…
Q: Make up a question that would involve interpolation and the use of the model (regression equation)…
A: Since the question number is not specified, we'll be answering the first question only. Please…
Q: What are the interpretations of the Y intercept and the slopes in a multiple regression model?
A: What are the interpretations of the Y intercept and the slopes in a multiple regression model?
Q: The table gives the amount of money (in dollars) spent on football by a major university. Letting xx…
A: Definition: Regression analysis is used measure the association between two are more variables…
Q: An admissions counselor is looking to determine an equation that relates the graduate grade point…
A: Given, the graduate grade point averages of students who are newly admitted to an academic program…
Q: Can that regression be used to estimate the effect of the national unemployment rate on an…
A:
Q: Write the linear regression equation that represents this set of data, rounding all coefficients to…
A:
Q: Describe the problem that outliers present for a regression analysis and outline what you could
A: Given information: It is required to describe the problem of the presence of outliers in the data.
Q: The local coffee shop keeps track of how much coffee they sell versus the temperature on that day,…
A:
Q: Describe in detail about regression lines?
A:
Q: 3) Use the regression equation to predict the price of a 2000 square foot house in South Salinas.
A: From the above question 3 3) Use the regression equation to predict the price of a 2000 square…
Q: Suppose that you have the following model and data to estimate the following equation
A: Given information: Given data represents the values of independent variables X2, X3 and the…
Q: Briefly describe what is meant by the problem of errors in measurement of the predictor variables…
A: Errors in Measurement:
Q: The local coffee shop keeps track of how much coffee they sell versus the temperature on that day,…
A: In this case, the independent variable is the temperature (x) and the dependent variable is the…
Q: Write the simple linear regression equation for miles per gallon as the response variable and weight…
A: For dependent random variable y and the independent random variable x, the simple linear regression…
Q: Explain the Regression Functions That Are Nonlinear in the Parameters?
A: Regression functions. The regression functions support the fitting of an ordinary-least-squares…
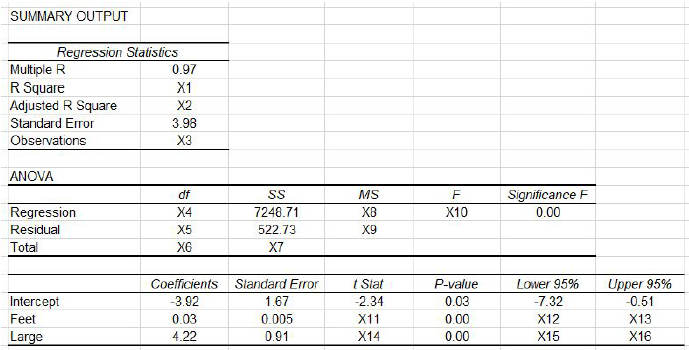
Refer Excel Output and answer the following questions.
1. State multiple regression equation
2. Interpret the meaning of two slopes in this equation
3. Interpret the meaning of adjusted r^2.


Trending now
This is a popular solution!

Step by step
Solved in 2 steps


- Rates of return (annualized) in two investment portfolios are compared over the last 12 quarters. They are considered similar in safety, but portfolio B is advertised as being “less volatile.” (a) At α = .025, does the sample show that portfolio A has significantly greater variance in rates of return than portfolio B? (b) At α = .025, is there a significant difference in the means? Portfolio A Portfolio B 5.23 8.96 10.91 8.60 12.49 7.61 4.17 6.60 5.54 7.77 8.68 7.06 7.89 7.68 9.82 7.62 9.62 8.71 4.93 8.97 11.66 7.71 11.49 9.91 Questions: (a-1) Choose the appropriate hypotheses. Assume σA2 is the variance of the Portfolio A and σB2 is the variance of the Portfolio B. multiple choice 1 H0: σA2/σB2 ≤ 1 versus H1: σA2/σB2 > 1 - Correct Answer H0: σA2/σB2 = 1 versus H1: σA2/σB2 ≠ 1 H0: σA2/σB2 ≥ 1 versus H1: σA2/σB2 < 1 (a-2) Specify the decision rule. (Round your answers to 2 decimal places.) Reject the null hypothesis if Fcalc >…Rates of return (annualized) in two investment portfolios are compared over the last 12 quarters. They are considered similar in safety, but portfolio B is advertised as being “less volatile.” (a) At α = .025, does the sample show that portfolio A has significantly greater variance in rates of return than portfolio B? (b) At α = .025, is there a significant difference in the means? Portfolio A Portfolio B 5.23 8.96 10.91 8.60 12.49 7.61 4.17 6.60 5.54 7.77 8.68 7.06 7.89 7.68 9.82 7.62 9.62 8.71 4.93 8.97 11.66 7.71 11.49 9.91 (b-1) Choose the appropriate hypotheses. Assume d = company assessed value – employee assessed value. multiple choice 3 H0: μ1 – μ2 = 0 vs. H1: μ1 – μ2 ≠ 0 H0: μ1 – μ2 ≥ 0 vs. H1: μ1 – μ2 < 0 H0: μ1 – μ2 ≤ 0 vs. H1: μ1 – μ2 > 0 (b-2) State the decision rule for .01 level of significance. (Round your answers to 3 decimal places. A negative value should be indicated by a minus sign.) Reject the null…Rates of return (annualized) in two investment portfolios are compared over the last 12 quarters. They are considered similar in safety, but portfolio B is advertised as being “less volatile.” (a) At α = .025, does the sample show that portfolio A has significantly greater variance in rates of return than portfolio B? (b) At α = .025, is there a significant difference in the means? Portfolio A Portfolio B 5.23 8.96 10.91 8.60 12.49 7.61 4.17 6.60 5.54 7.77 8.68 7.06 7.89 7.68 9.82 7.62 9.62 8.71 4.93 8.97 11.66 7.71 11.49 9.91 (b-1) Choose the appropriate hypotheses. Assume d = company assessed value – employee assessed value. multiple choice 3 H0: μ1 – μ2 = 0 vs. H1: μ1 – μ2 ≠ 0 H0: μ1 – μ2 ≥ 0 vs. H1: μ1 – μ2 < 0 H0: μ1 – μ2 ≤ 0 vs. H1: μ1 – μ2 > 0 (b-2) State the decision rule for .01 level of significance. (Round your answers to 3 decimal places. A negative value should be indicated by a minus sign.) Reject the null…
- 3.Which model do you think is the “best” reduced model? Discuss why you choose this model. Analysis of Variance Table (Step back model) Response: rent Df Sum Sq Mean Sq F value Pr(>F) age 1 21000 21000 17.1136 0.0003079 *** sqft 1 35364 35364 28.8196 1.134e-05 *** sd 1 5961 5961 4.8576 0.0362339 * unts 1 8678 8678 7.0722 0.0130049 * gar 1 33364 33364 27.1899 1.713e-05 *** cp 1 7641 7641 6.2269 0.0189934 * Residuals 27 33131 1227 --- Signif. codes: 0 ‘***’ 0.001 ‘**’ 0.01 ‘*’ 0.05 ‘.’ 0.1 ‘ ’ 1 Step forward model: Response: rent Df Sum Sq Mean Sq F value Pr(>F) age 1 21000 21000 16.6255 0.000406 *** sqft 1 35364 35364 27.9976 1.757e-05 *** sd 1 5961 5961 4.7191 0.039517 * unts 1 8678 8678 6.8705 0.014697 * gar 1 33364 33364 26.4144 2.599e-05 *** cp 1 7641 7641 6.0493 0.021176 *…Analysis of Variance (ANOVA) Health professionals conducted a research study to examine whether people consumed more calories at a fast-food restaurant when the method of payment for their food differed. They hypothesized that people would order more food when they paid with a credit card or a gift certificate compared to cash. Test the null hypothesis that the number of calories consumed does not differ by method of payment. Write a concluding statement. Cash Credit Gift Certificate 1200 1350 1400 1050 1125 1250 700 1050 1000 1450 1680 1950 1365 1380 1400Characteristics Treatment Control P-value Mean SBP 115.3889± 113.0588±6.805 Mean difference (SBP) -0.66±3.0292 2.117 ±2.471 0.005347 Mean DBP 74.556± 7.366 72.4705±6.374 Mean difference (DBP) -1.888±2.9483 1.411765 ±3.3343 0.002233 Mean Pulse rate 96.222±13.0 88.94±15.43725 Mean difference -9.444± 0.5294118± 0.3529523 write an analysis for the data above and what does the p value mean?
- Data: Rate difference per 1000 PY: ___-2.17__; 95% CI __-4.30___ to _-0.03____ HR: __79___; 95% CI _0.63____ to _0.99____ Which statement is the most correct interpretation of the risk of pooled stroke or systemic emboli in the propensity-matched analysis? Apixaban resulted in a statistically significant decrease in stroke or systemic emboli compared to rivaroxaban Apixaban resulted in a statistically significant increase in stroke or systemic emboli compared to rivaroxaban There was no statistically significant difference in stroke or systemic emboli between apixaban and rivaroxaban.A Cox proportional hazards model is estimated relating time to psychiatric hospitalization in patients with severe mental illness. The risk factors include age, sex, prior hospitalization for mental illness, and an indicator of bipolar disorder. The parameter estimates and significance levels for the model are shown here. Which of the predictors are statistically significantly associated with time to psychiatric hospitalization? Predictor Parameter Estimate p-value Age, years 0.0045 0.5647 Sex (0 = female, 1 = male) –0.4841 0.0341 Prior hospitalization (0 = no, 1 = yes) 0.3726 0.6178 Bipolar disorder (0 = no, 1 = yes) 0.7561 0.0042 .Predicting GPA based upon high school average is an example of. aclassification bvalue estimation ccausal modeling d
- Fuel economy A consumer organization has reported test data for 50 car models. We will examine the asso-ciation between the weight of the car (in thousands of pounds) and the fuel efficiency (in miles per gallon).Here are the scatterplot, summary statistics, andregression analysis:Variable Count Mean StdDevMPG 50 25.0200 4.83394wt/1000 50 2.88780 0.511656Dependent variable is: MPGR-squared = 75.6%s = 2.413 with 50 - 2 = 48 dfVariable Coefficient SE(Coeff) t-ratio P-valueIntercept 48.7393 1.976 24.7 ...0.0001Weight -8.21362 0.6738 -12.2 ...0.0001 a) Is there strong evidence of an association between the weight of a car and its gas mileage? Write an appropri-ate hypothesis. b) Are the assumptions for regression satisfied?c) Test your hypothesis and state your conclusion.Quantitative Research Statistical Data Analysis using Software ( SPSS / PLS - SEM ) 1 ) Study the provided videos on preparing and testing SPSS / PLS - SEM 2 ) Interpret the data which has been presented in the below Table 1 and Table 2Palisades Eco-Park is a small ecological reserve that admits a relatively small number of visitors on any day, but provides both educational and entertaining lectures, exhibitions, and opportunities to observe nature. The company has collected the following data on labor costs and number of visitors to the park over the last 30 months. Month Labor Cost Visitors 1 $ 25,520 1,400 2 $ 35,869 2,135 3 $ 39,504 2,315 4 $ 31,280 1,830 5 $ 34,405 1,954 6 $ 32,293 1,796 7 $ 31,651 1,816 8 $ 37,889 2,204 9 $ 38,120 2,273 10 $ 46,387 2,941 11 $ 41,667 2,451 12 $ 38,576 2,309 13 $ 34,044 1,989 14 $ 32,788 1,924 15 $ 36,542 2,065 16 $ 26,192 1,729 17 $ 30,307 2,797 18 $ 29,613 2,294 19 $ 27,270 1,986 20 $ 29,654 2,448 21 $ 25,394 1,647 22 $ 24,369 1,478 23 $ 28,556 2,690 24 $ 29,803 3,144 25 $ 27,792 2,135 26 $ 31,322 2,696 27 $ 28,318 2,462 28 $ 29,579 2,512 29 $ 28,108 2,068 30 $ 27,550 1,709 Required: a. Estimate the labor…
