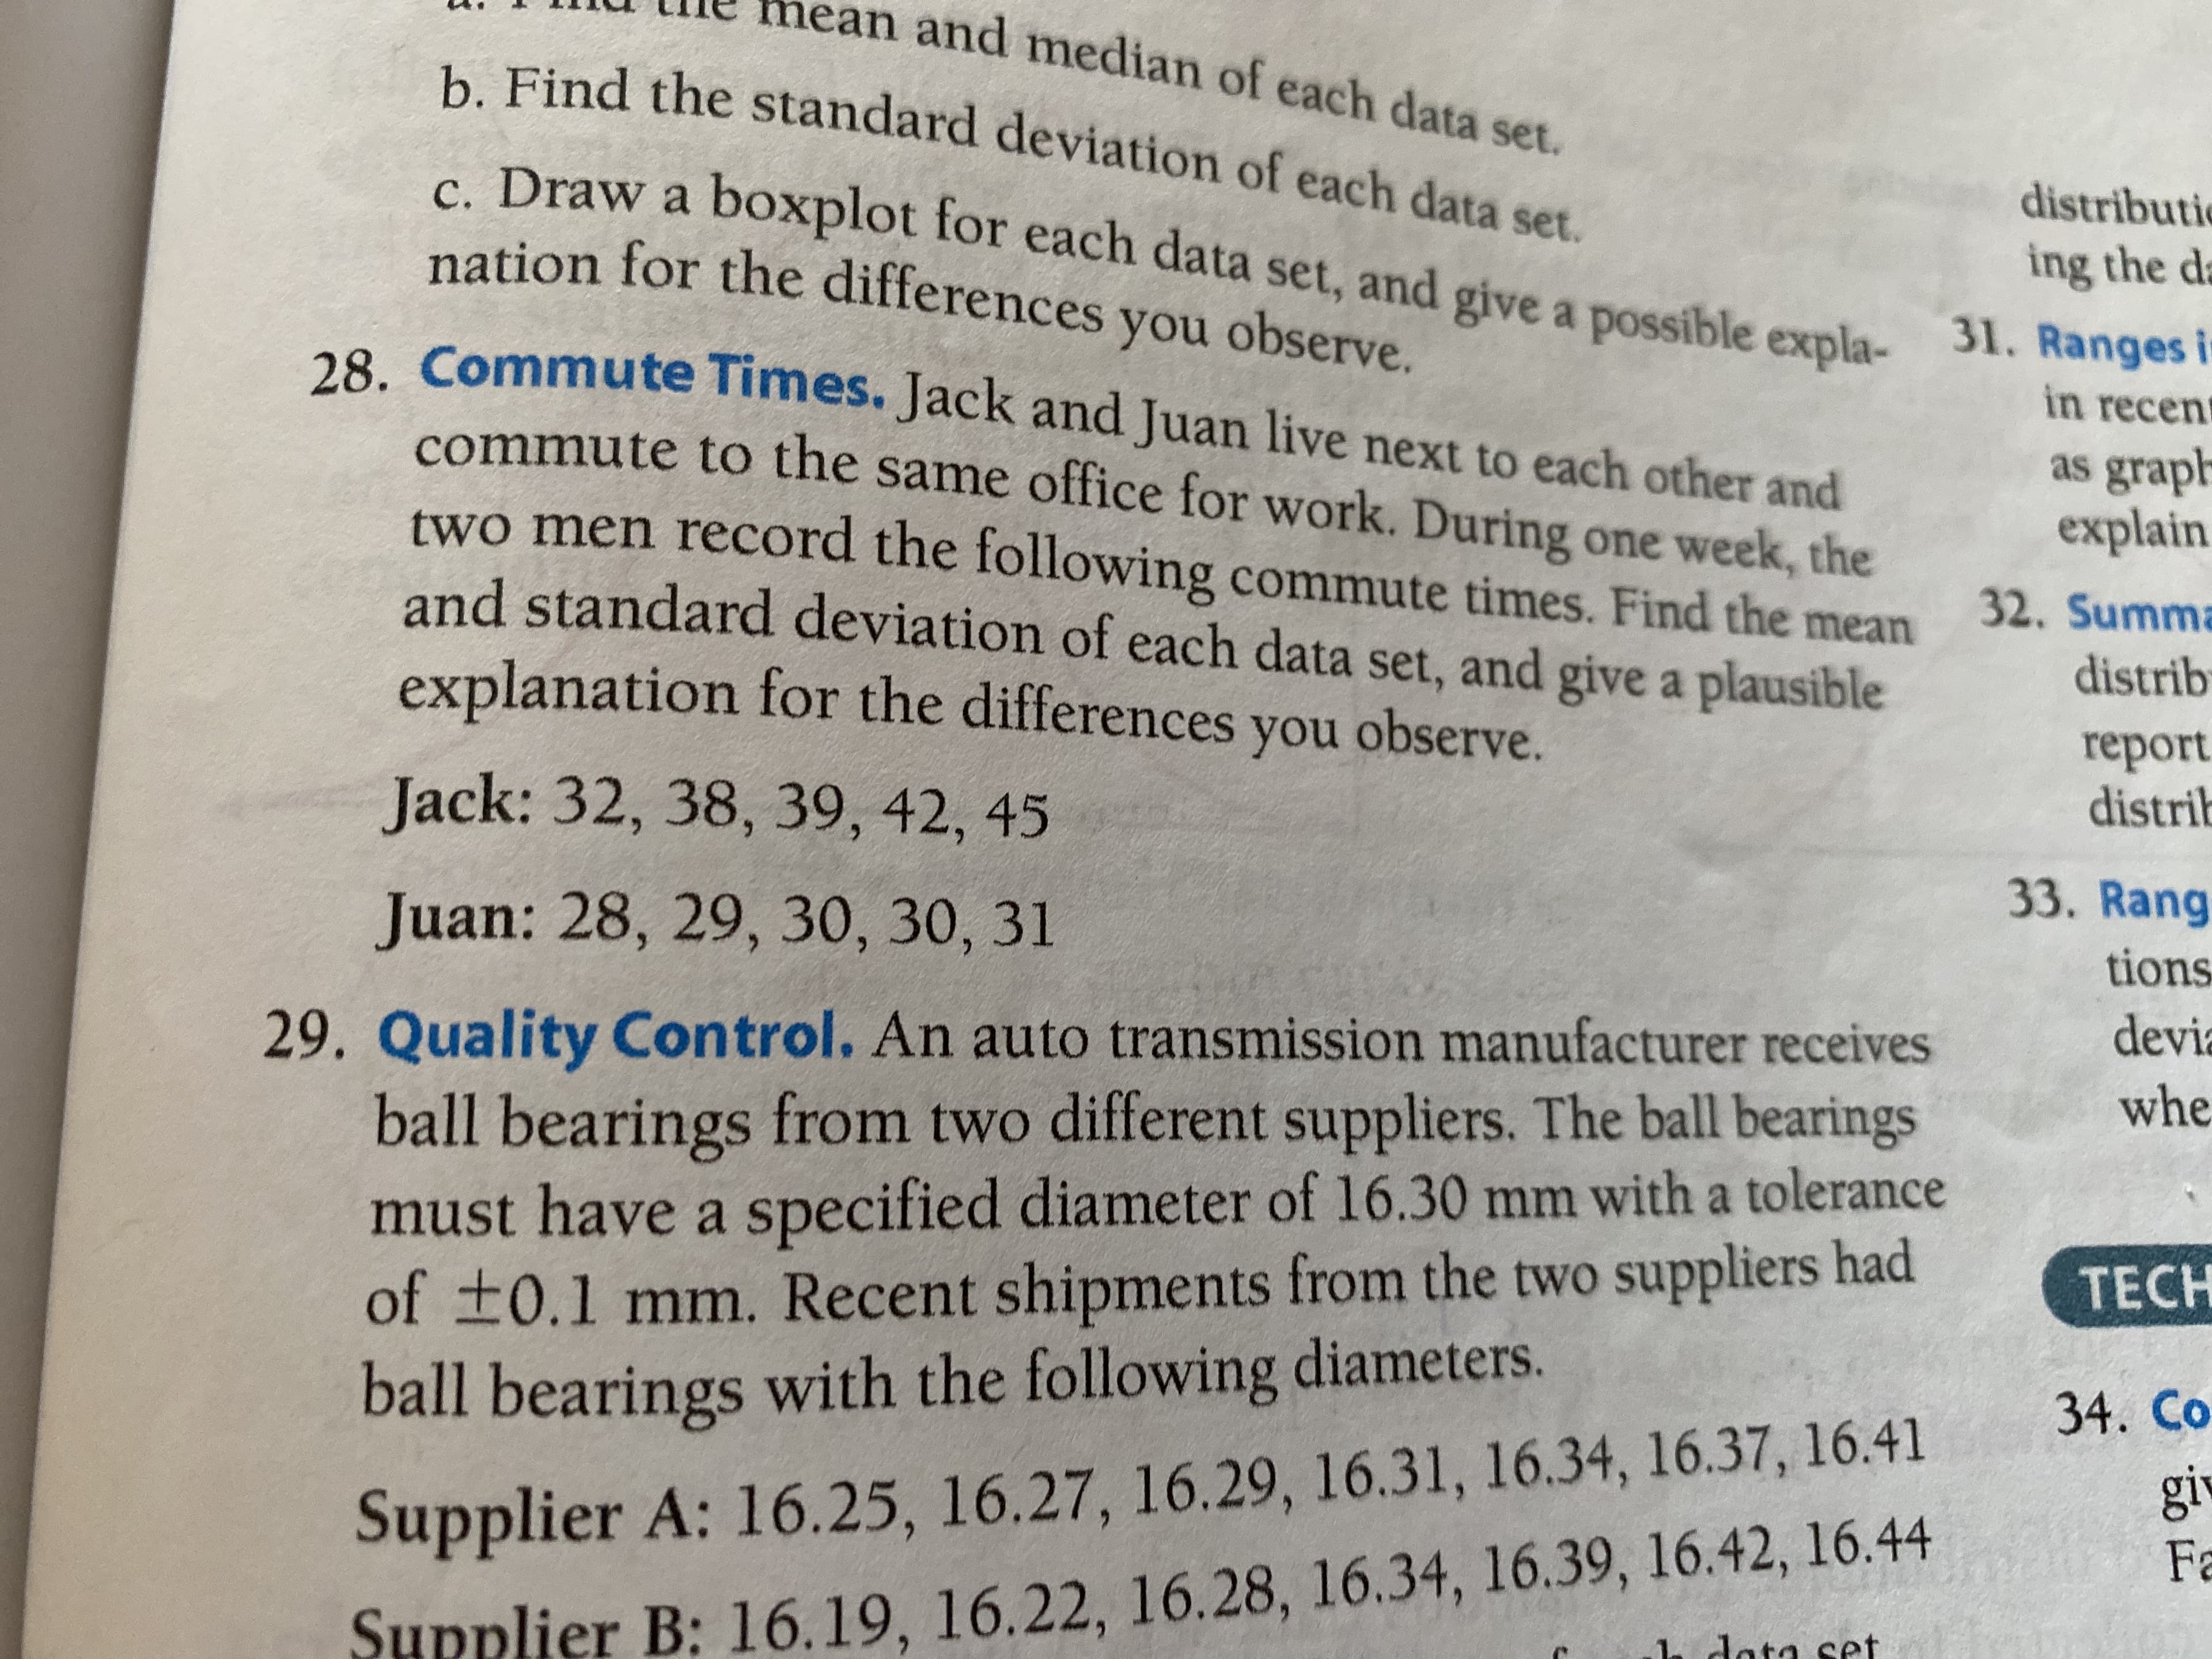
Remove any identified outlier from the data for the rest of this problem. c) Give the five-number summary and draw a boxplot for each of the two data sets. B sure that your boxplots are on one number line (like in the sample problem) without any numbers on the boxes (see the sample) d) Based on your results, compare and discuss the two data sets in terms of their center and variation. Follow the textbook directions - be sure to review the sample standard deviation calculation before doing this problem and use it as a sample for your work and how much detail should be in your results. Be sure to do everything asked in the textbook 28 directions. MacBook Air nean and median of each data set. b. Find the standard deviation of each data set. distributie c. Draw a boxplot for each data set, and give a possible expla- 31. Ranges i- nation for the differences you observe. ing the da 28. Commute Times. Jack and Juan live next to each other and in recent commute to the same office for work. During one week, the as graph explain two men record the following commute times. Find the mean 32. Summa distrib and standard deviation of each data set, and give a plausible explanation for the differences you observe. report distrib Jack: 32, 38, 39, 42, 45 33. Rang Juan: 28, 29, 30, 30, 31 tions devia 29. Quality Control. An auto transmission manufacturer receives whe ball bearings from two different suppliers. The ball bearings must have a specified diameter of 16.30 mm with a tolerance of t0.1 mm. Recent shipments from the two suppliers had ball bearings with the following diameters. TECH 34. Co giv Supplier A: 16.25, 16.27, 16.29, 16.31, 16.34, 16.37, 16.41 Fa h dota set Supplier B: 16.19, 16.22, 16.28, 16.34, 16.39, 16.42, 16.44
Remove any identified outlier from the data for the rest of this problem. c) Give the five-number summary and draw a boxplot for each of the two data sets. B sure that your boxplots are on one number line (like in the sample problem) without any numbers on the boxes (see the sample) d) Based on your results, compare and discuss the two data sets in terms of their center and variation. Follow the textbook directions - be sure to review the sample standard deviation calculation before doing this problem and use it as a sample for your work and how much detail should be in your results. Be sure to do everything asked in the textbook 28 directions. MacBook Air nean and median of each data set. b. Find the standard deviation of each data set. distributie c. Draw a boxplot for each data set, and give a possible expla- 31. Ranges i- nation for the differences you observe. ing the da 28. Commute Times. Jack and Juan live next to each other and in recent commute to the same office for work. During one week, the as graph explain two men record the following commute times. Find the mean 32. Summa distrib and standard deviation of each data set, and give a plausible explanation for the differences you observe. report distrib Jack: 32, 38, 39, 42, 45 33. Rang Juan: 28, 29, 30, 30, 31 tions devia 29. Quality Control. An auto transmission manufacturer receives whe ball bearings from two different suppliers. The ball bearings must have a specified diameter of 16.30 mm with a tolerance of t0.1 mm. Recent shipments from the two suppliers had ball bearings with the following diameters. TECH 34. Co giv Supplier A: 16.25, 16.27, 16.29, 16.31, 16.34, 16.37, 16.41 Fa h dota set Supplier B: 16.19, 16.22, 16.28, 16.34, 16.39, 16.42, 16.44

Glencoe Algebra 1, Student Edition, 9780079039897, 0079039898, 2018
18th Edition
ISBN:9780079039897
Author:Carter
Publisher:Carter
Chapter10: Statistics
Section10.5: Comparing Sets Of Data
Problem 26PFA

Related questions

Concept explainers
Equations and Inequations
Equations and inequalities describe the relationship between two mathematical expressions.
Linear Functions
A linear function can just be a constant, or it can be the constant multiplied with the variable like x or y. If the variables are of the form, x2, x1/2 or y2 it is not linear. The exponent over the variables should always be 1.
Question
How do I do question. 28

Transcribed Image Text:Remove any identified outlier from the data for the rest of this problem.
c) Give the five-number summary and draw a boxplot for each of the two data sets. B
sure that your boxplots are on one number line (like in the sample problem)
without
any numbers on the boxes (see the sample)
d) Based on your results, compare and discuss the two data sets in terms of their
center and variation.
Follow the textbook directions - be sure to review the sample standard deviation
calculation before doing this problem and use it as a sample for your work and how
much detail should be in your results. Be sure to do everything asked in the textbook
28
directions.
MacBook Air
Transcribed Image Text:nean and median of each data set.
b. Find the standard deviation of each data set.
distributie
c. Draw a boxplot for each data set, and give a possible expla- 31. Ranges i-
nation for the differences you observe.
ing the da
28. Commute Times. Jack and Juan live next to each other and
in recent
commute to the same office for work. During one week, the
as graph
explain
two men record the following commute times. Find the mean
32. Summa
distrib
and standard deviation of each data set, and give a plausible
explanation for the differences you observe.
report
distrib
Jack: 32, 38, 39, 42, 45
33. Rang
Juan: 28, 29, 30, 30, 31
tions
devia
29. Quality Control. An auto transmission manufacturer receives
whe
ball bearings from two different suppliers. The ball bearings
must have a specified diameter of 16.30 mm with a tolerance
of t0.1 mm. Recent shipments from the two suppliers had
ball bearings with the following diameters.
TECH
34. Co
giv
Supplier A: 16.25, 16.27, 16.29, 16.31, 16.34, 16.37, 16.41
Fa
h dota set
Supplier B: 16.19, 16.22, 16.28, 16.34, 16.39, 16.42, 16.44
Expert Solution
This question has been solved!
Explore an expertly crafted, step-by-step solution for a thorough understanding of key concepts.

This is a popular solution!

Trending now
This is a popular solution!

Step by step
Solved in 3 steps with 4 images

Knowledge Booster


Learn more about
Need a deep-dive on the concept behind this application? Look no further. Learn more about this topic, statistics and related others by exploring similar questions and additional content below.Recommended textbooks for you
Glencoe Algebra 1, Student Edition, 9780079039897…
Algebra
ISBN:
9780079039897
Author:
Carter
Publisher:
McGraw Hill

Holt Mcdougal Larson Pre-algebra: Student Edition…
Algebra
ISBN:
9780547587776
Author:
HOLT MCDOUGAL
Publisher:
HOLT MCDOUGAL

College Algebra (MindTap Course List)
Algebra
ISBN:
9781305652231
Author:
R. David Gustafson, Jeff Hughes
Publisher:
Cengage Learning
Glencoe Algebra 1, Student Edition, 9780079039897…
Algebra
ISBN:
9780079039897
Author:
Carter
Publisher:
McGraw Hill
Holt Mcdougal Larson Pre-algebra: Student Edition…
Algebra
ISBN:
9780547587776
Author:
HOLT MCDOUGAL
Publisher:
HOLT MCDOUGAL
College Algebra (MindTap Course List)
Algebra
ISBN:
9781305652231
Author:
R. David Gustafson, Jeff Hughes
Publisher:
Cengage Learning
