researcher conclude that risk differs with age? Test at a = .05 8. A researcher is investigating the relationship between academic performance and self-esteem. A sample of n-150 twelve year old children is obtained, and each chile is classified by level of academic performance and level of self-esteem. The frequency distribution for this sample is shown in the table below. Academic Performance Self Esteem Low Medium High Low 34 43 13 High 11 32 17 Is there a relationship between academic performance and level of self-esteem? Test at a = .05 9. Recent recession and bad economic conditions forced many people to hold more than ronSnho held more than one job produced the following
researcher conclude that risk differs with age? Test at a = .05 8. A researcher is investigating the relationship between academic performance and self-esteem. A sample of n-150 twelve year old children is obtained, and each chile is classified by level of academic performance and level of self-esteem. The frequency distribution for this sample is shown in the table below. Academic Performance Self Esteem Low Medium High Low 34 43 13 High 11 32 17 Is there a relationship between academic performance and level of self-esteem? Test at a = .05 9. Recent recession and bad economic conditions forced many people to hold more than ronSnho held more than one job produced the following

Holt Mcdougal Larson Pre-algebra: Student Edition 2012
1st Edition
ISBN:9780547587776
Author:HOLT MCDOUGAL
Publisher:HOLT MCDOUGAL
Chapter11: Data Analysis And Probability
Section: Chapter Questions
Problem 8CR

Related questions
Question
100%
Hi I have a problem on question 8. How do I identify whether it's a chi square independent or chi square goodness of fit.
And can you please show me the hand calculations methods without using Excel. Like show every step on how to do the question do that I can understand the steps clearly. Also attached the chi square critical table.
Transcribed Image Text:2.
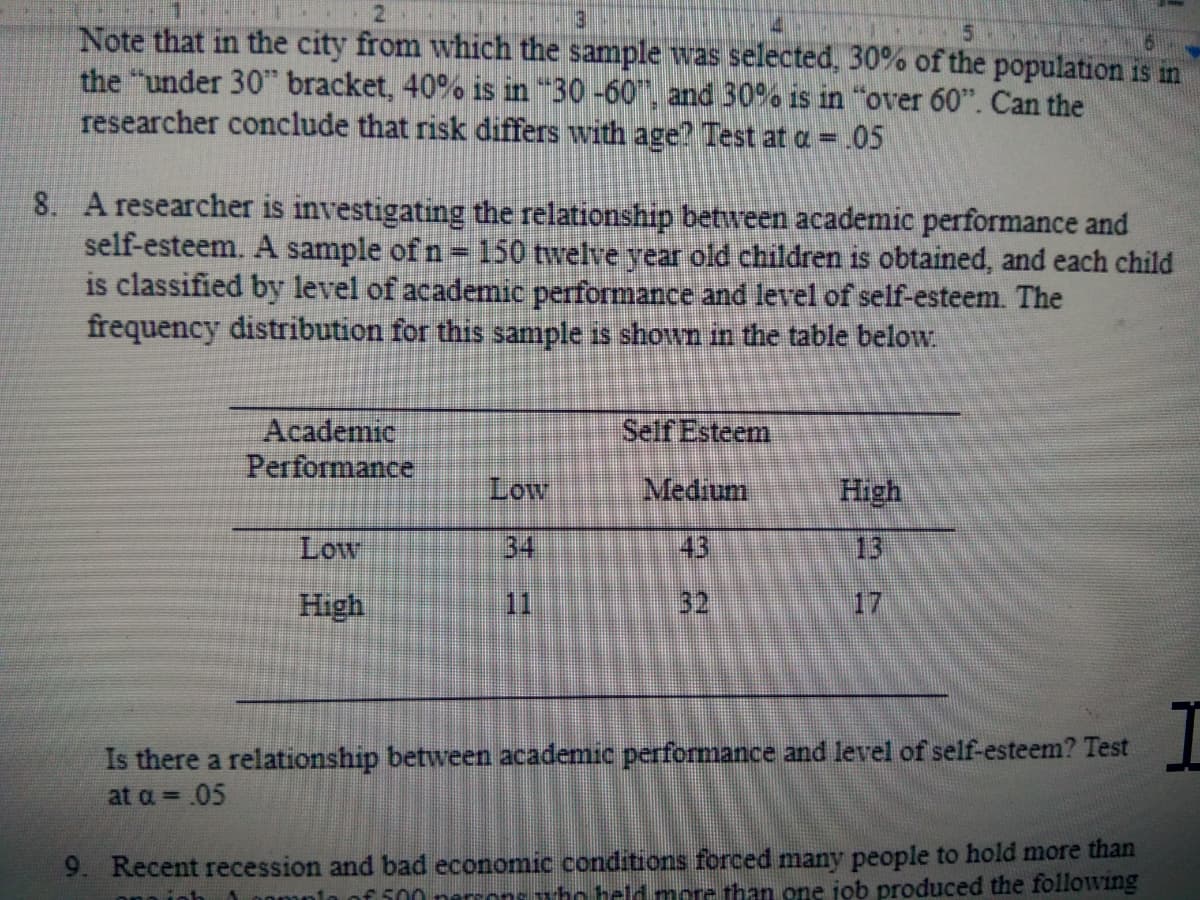
Note that in the city from which the sample was selected, 30% of the population is in
the "under 30" bracket, 40% is in 30 -60", and 30% is in "over 60". Can the
researcher conclude that risk differs with age? Test at a= .05
8. A researcher is investigating the relationship between academic performance and
self-esteem. A sample of n-150 twelve year old children is obtained, and each child
is classified by level of academic performance and level of self-esteem. The
frequency distribution for this sample is shown in the table below.
Academic
Performance
Self Esteem
Low
Medium
High
Low
34
43
13
High
32
17
I
Is there a relationship between academic performance and level of self-esteem? Test
at a = .05
9. Recent recession and bad economic conditions forced many people to hold more than
Tho held more than one job produced the following
€ 50
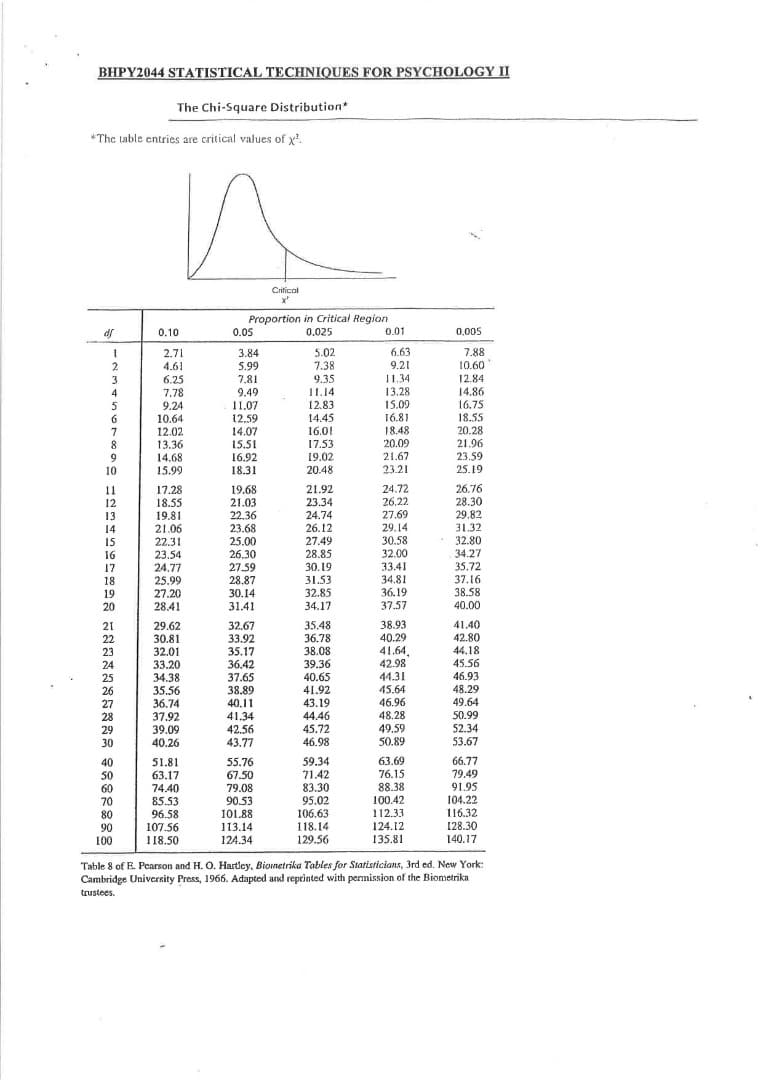
Transcribed Image Text:BHPY2044 STATISTICAL TECHNIQUES FOR PSYCHOLOGY II
The Chi-Square Distribution
*The table entries are critical values of x
Crifical
Proportion in Critical Region
0.025
0.10
0.05
0.01
0,005
6.63
7.88
10.60
12.84
14.86
16.75
18.55
20.28
21.96
23.59
25.19
5.02
7.38
2.71
3.84
2
4.61
9.21
6.25
7.78
9.24
10.64
12.02
13.36
14.68
15.99
5.99
7.81
9.49
11.07
12,59
14.07
15.51
16.92
18.31
11.34
13.28
15.09
16.81
18.48
20.09
9.35
IL.14
12.83
14.45
16.01
17.53
19.02
20.48
5
7
8.
9
21.67
10
23.21
17.28
18.55
19.81
21.06
22.31
23.54
24.77
25.99
27.20
28.41
19.68
21.03
22.36
23.68
25.00
26.30
27.59
28.87
30.14
31.41
24.72
26.22
27.69
29.14
30.58
32.00
33.41
34.81
36.19
37.57
26.76
28.30
29.82
31.32
32.80
34.27
35.72
37.16
38.58
11
21.92
12
23.34
13
24.74
14
26.12
15
27.49
16
28.85
17
30.19
18
31.53
19
32.85
20
34.17
40.00
38.93
40.29
41.64
42.98
44.31
45.64
46.96
48.28
49.59
50.89
41.40
42.80
32.67
33.92
35.17
36.42
37.65
38.89
40.11
35.48
36.78
38.08
39.36
40.65
41.92
21
29.62
30.81
32.01
33.20
34.38
22
23
44.18
24
45.56
46.93
48.29
25
26
27
28
35.56
36.74
37.92
39.09
40.26
43.19
44.46
45.72
49.64
41.34
42.56
43.77
50.99
52.34
53.67
29
30
46.98
63.69
66.77
59.34
71.42
40
50
60
70
80
90
100
51.81
55.76
79.49
91.95
104.22
16.32
63.17
67.50
76.15
88.38
100.42
74.40
83.30
95.02
106.63
118.14
129.56
79.08
85.53
96.58
107.56
118.50
90.53
101.88
112.33
124.12
135.81
113.14
128.30
124.34
140.17
Table 8 of E. Pearson and H. O. Hartley, Bionetrika Tables for Statisticians, 3rd ed. New York:
Cambridge Univernity Press, 1966. Adapted and reprinted with permission of the Biometrika
trustees.
Expert Solution
This question has been solved!
Explore an expertly crafted, step-by-step solution for a thorough understanding of key concepts.

Step by step
Solved in 2 steps with 2 images

Knowledge Booster


Learn more about
Need a deep-dive on the concept behind this application? Look no further. Learn more about this topic, statistics and related others by exploring similar questions and additional content below.Recommended textbooks for you
Holt Mcdougal Larson Pre-algebra: Student Edition…
Algebra
ISBN:
9780547587776
Author:
HOLT MCDOUGAL
Publisher:
HOLT MCDOUGAL

Glencoe Algebra 1, Student Edition, 9780079039897…
Algebra
ISBN:
9780079039897
Author:
Carter
Publisher:
McGraw Hill
Holt Mcdougal Larson Pre-algebra: Student Edition…
Algebra
ISBN:
9780547587776
Author:
HOLT MCDOUGAL
Publisher:
HOLT MCDOUGAL
Glencoe Algebra 1, Student Edition, 9780079039897…
Algebra
ISBN:
9780079039897
Author:
Carter
Publisher:
McGraw Hill