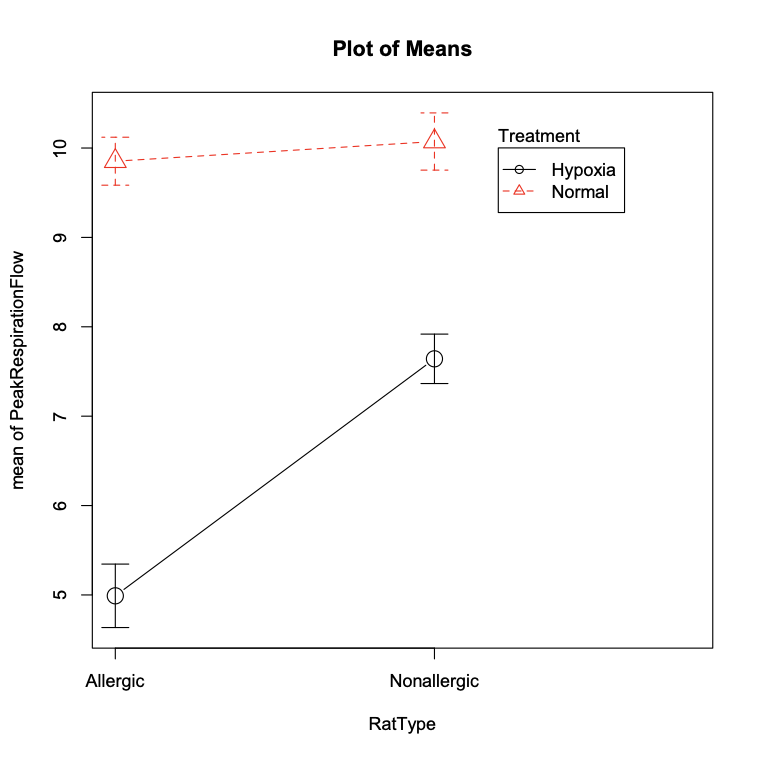
Researchers have suggested that sleep apnoea (the tendency to occasionally stop breathing when asleep) may worsen the effects of allergen-induced asthma. To investigate this possibility, Johnson and colleagues (2015), compared two groups of rats, a normal healthy non-allergic group, and a second group that were mildly allergic to ovalbumin. They subjected these rats to one of two treatments – 1) a 10-minute period of induced hypoxia (oxygen down to 10% of the air), representing the kind of temporary hypoxia that sufferers of sleep apnoea may be subjected to, and 2) a control (normal air) group. They then compared the respiratory function of both groups in these two treatments by using a two-factor ANOVA. (Questions are on the next page). Source df F P Rat type 1 21.88 <0.0001 Oxygen treatment 1 141.13 <0.0001 Rat type x oxygen treatment 1 15.68 <0.001 Residual 36 What are the 3 null hypotheses are being tested in the ANOVA? What is the result of the test of the interaction effect from this analysis? What would be the most correct interpretation this result, based on the plot of means?


question 1
Researchers have suggested that sleep apnoea (the tendency to occasionally stop breathing when asleep) may worsen the effects of allergen-induced asthma. To investigate this possibility, Johnson and colleagues (2015), compared two groups of rats, a normal healthy non-allergic group, and a second group that were mildly allergic to ovalbumin. They subjected these rats to one of two treatments – 1) a 10-minute period of induced hypoxia (oxygen down to 10% of the air), representing the kind of temporary hypoxia that sufferers of sleep apnoea may be subjected to, and 2) a control (normal air) group. They then compared the respiratory
|
Source |
df |
F |
P |
|
Rat type |
1 |
21.88 |
<0.0001 |
|
Oxygen treatment |
1 |
141.13 |
<0.0001 |
|
Rat type x oxygen treatment |
1 |
15.68 |
<0.001 |
|
Residual |
36 |
|
|
- What are the 3 null hypotheses are being tested in the ANOVA?
- What is the result of the test of the interaction effect from this analysis?
- What would be the most correct interpretation this result, based on the plot of means?

Step by step
Solved in 3 steps
