Revenue and expense data for Innovation Quarter Inc. for two recent years are as follows: Current Year Previous Year Sales $493,000 $419,000 Cost of goods sold 281,010 213,690 83,810 Selling expenses 83,800 Administrative expenses 93,670 71,230 Income tax expense 14,790 20,950 a. Prepare an income statement in comparative form, stating each item for both years as a percent of sales. If required, round percentages to one decimal place. Enter all amour nounts as positive numbers. Innovation Quarter Inc Comparative Income Statement For the Years Ended December 31 Current year Amount Current year Percent Previous year Amount Previous year Percent Sales $493,000 $419,000 281,010 213,690 Cost of goods sold Selling expenses 83,810 83,800 96 96 93,670 71,230 Administrative expenses Innovation Quarter Inc. Comparative Income Statement For the Years Ended December 31 Current year Amount Current year Percent Previous year Amount Previous year Percent $493,000 Sales $419,000 281,010 213,690 Cost of goods sold 9% % Selling expenses 83,810 83,800 % 71,230 Administrative expenses 93,670 % % Income tax expense 14,790 20,950 b. The vertical analysis indicates that the cost of goods sold as a percent of sales by 6 percentage points, while selling expenses by 3 by 2 percentage points. Thus, net income as a percent of sales by 3 percentage points. percentage points, and administrative expenses
Revenue and expense data for Innovation Quarter Inc. for two recent years are as follows: Current Year Previous Year Sales $493,000 $419,000 Cost of goods sold 281,010 213,690 83,810 Selling expenses 83,800 Administrative expenses 93,670 71,230 Income tax expense 14,790 20,950 a. Prepare an income statement in comparative form, stating each item for both years as a percent of sales. If required, round percentages to one decimal place. Enter all amour nounts as positive numbers. Innovation Quarter Inc Comparative Income Statement For the Years Ended December 31 Current year Amount Current year Percent Previous year Amount Previous year Percent Sales $493,000 $419,000 281,010 213,690 Cost of goods sold Selling expenses 83,810 83,800 96 96 93,670 71,230 Administrative expenses Innovation Quarter Inc. Comparative Income Statement For the Years Ended December 31 Current year Amount Current year Percent Previous year Amount Previous year Percent $493,000 Sales $419,000 281,010 213,690 Cost of goods sold 9% % Selling expenses 83,810 83,800 % 71,230 Administrative expenses 93,670 % % Income tax expense 14,790 20,950 b. The vertical analysis indicates that the cost of goods sold as a percent of sales by 6 percentage points, while selling expenses by 3 by 2 percentage points. Thus, net income as a percent of sales by 3 percentage points. percentage points, and administrative expenses

Financial Accounting
14th Edition
ISBN:9781305088436
Author:Carl Warren, Jim Reeve, Jonathan Duchac
Publisher:Carl Warren, Jim Reeve, Jonathan Duchac
Chapter17: Financial Statement Analysis
Section: Chapter Questions
Problem 1E: Revenue and expense data for Gresham Inc. for two recent years are as follows: a. Prepare an income...

Related questions
Question
100%
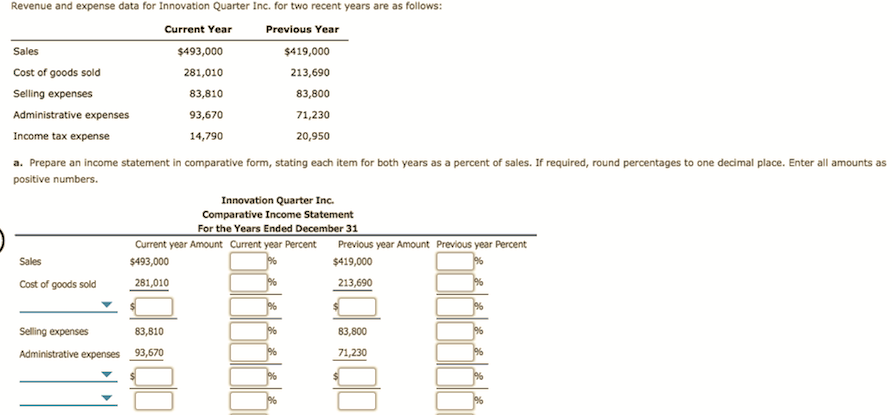
Transcribed Image Text:Revenue and expense data for Innovation Quarter Inc. for two recent years are as follows:
Current Year
Previous Year
Sales
$493,000
$419,000
Cost of goods sold
281,010
213,690
83,810
Selling expenses
83,800
Administrative expenses
93,670
71,230
Income tax expense
14,790
20,950
a. Prepare an income statement in comparative form, stating each item for both years as a percent of sales. If required, round percentages to one decimal place. Enter all amour
nounts as
positive numbers.
Innovation Quarter Inc
Comparative Income Statement
For the Years Ended December 31
Current year Amount Current year Percent
Previous year Amount Previous year Percent
Sales
$493,000
$419,000
281,010
213,690
Cost of goods sold
Selling expenses
83,810
83,800
96
96
93,670
71,230
Administrative expenses
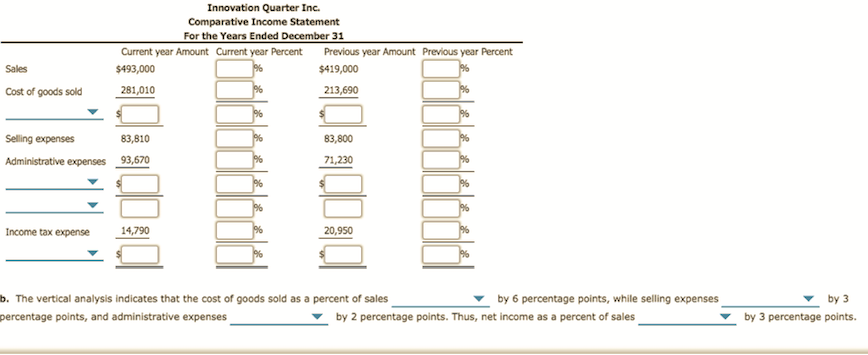
Transcribed Image Text:Innovation Quarter Inc.
Comparative Income Statement
For the Years Ended December 31
Current year Amount Current year Percent
Previous year Amount Previous year Percent
$493,000
Sales
$419,000
281,010
213,690
Cost of goods sold
9%
%
Selling expenses
83,810
83,800
%
71,230
Administrative expenses 93,670
%
%
Income tax expense
14,790
20,950
b. The vertical analysis indicates that the cost of goods sold as a percent of sales
by 6 percentage points, while selling expenses
by 3
by 2 percentage points. Thus, net income as a percent of sales
by 3 percentage points.
percentage points, and administrative expenses
Expert Solution
This question has been solved!
Explore an expertly crafted, step-by-step solution for a thorough understanding of key concepts.

This is a popular solution!

Trending now
This is a popular solution!

Step by step
Solved in 2 steps with 1 images

Recommended textbooks for you
Financial Accounting
Accounting
ISBN:
9781305088436
Author:
Carl Warren, Jim Reeve, Jonathan Duchac
Publisher:
Cengage Learning

Managerial Accounting
Accounting
ISBN:
9781337912020
Author:
Carl Warren, Ph.d. Cma William B. Tayler
Publisher:
South-Western College Pub

Managerial Accounting: The Cornerstone of Busines…
Accounting
ISBN:
9781337115773
Author:
Maryanne M. Mowen, Don R. Hansen, Dan L. Heitger
Publisher:
Cengage Learning
Financial Accounting
Accounting
ISBN:
9781305088436
Author:
Carl Warren, Jim Reeve, Jonathan Duchac
Publisher:
Cengage Learning
Managerial Accounting
Accounting
ISBN:
9781337912020
Author:
Carl Warren, Ph.d. Cma William B. Tayler
Publisher:
South-Western College Pub
Managerial Accounting: The Cornerstone of Busines…
Accounting
ISBN:
9781337115773
Author:
Maryanne M. Mowen, Don R. Hansen, Dan L. Heitger
Publisher:
Cengage Learning

Financial Accounting
Accounting
ISBN:
9781337272124
Author:
Carl Warren, James M. Reeve, Jonathan Duchac
Publisher:
Cengage Learning

Survey of Accounting (Accounting I)
Accounting
ISBN:
9781305961883
Author:
Carl Warren
Publisher:
Cengage Learning

Intermediate Accounting: Reporting And Analysis
Accounting
ISBN:
9781337788281
Author:
James M. Wahlen, Jefferson P. Jones, Donald Pagach
Publisher:
Cengage Learning