Road Kings 2014 Year Year Year Year Year Year Year Year Year Year Year Year Year Year 1 4 Z 10 11 12 13 OPERATING SUMMARY Price per bus 225,500 225,500 225,500 225,500 225,500 225,500 225,500 225,500 225,500 225,500 225,500 225,500 225,500 Units sold 7,750 7,750 7,750 7,750 7,750 7,750 7,750 7,750 7,750 7,750 7,750 7,750 7,750 Revenues 1,747.625,000 1,747.625.000 1,747.625.000 1.747.625.000 1,747.625.000 1,747.625,000 1,747.625.000 1,747.625,000 1,747.625.000 1,747,625.000 1.747.625.000 1,747.625,000 Labor per unit Parts per unit engine Detroit Sales/Administration per year Bus Warranty per unit Engine Warranty per unit Depreciation 52,000 52,000 52,000 52,000 52,000 52,000 52.000 52,000 52,000 52,000 52,000 52,000 52,000 94,000 94,000 94,000 94,000 94,000 94,000 94,000 94,000 94,000 94,000 94,000 94.000 94,000 20,000 155,000,000 155,000,000 155,000,000 155,000,000 155,000,000 155,000,000 155,000,000 155,000,000 155,000,000 155,000,000 155,000,000 155,000,000 250,000,000 250.000.000 250,000,000 250,000,000 250,000,000 250,000.000 250,000,000 250,000,000 250,000,000 250,000,000 250,000,000 250,000,000 250,000,000 0 0 0 0 4.776 1,100 1,100 1,100 1,100 1,100 0 0 0 6.512 1,000 1,000 1,000 1000 1,000 1.000 1.000 1,000 1,000 1.000 1,000 1,000 300,000,000 480.000,000 600.000,000 60,000,000 60.000,000 120,000,000 180,000,000 240,000,000 360,000,000 420,000,000 540,000,000 660,000,000 720,000,000 ЕBIT (5000) 1,282,476,900 1,222,476,900 1,162,476,900 1,102,476,900 1,042,476,900 769,486,140 512.990.760 60,000,000 982.478,000 589,486,800 862,478,000 517,486,800 344,991,200 480,000,000 742,478,000 682,478,000 622,478,000 373,486,800 922,478,000 802,478,000 Taxes 40 % 60% 733.486,140 697,486,140 661.486,140 625,486,140 553,486.800 481,486,800 445.486,800 409.486,800 NOPAT (S000) 296,991,200 272,991,200 660,000,000 488,990,760 464,990,760 440,990,760 1,042,476.900 240.000,000 392,991,200 368,991,200 320,991,200 248,991,200 Add back depreciation Operating Cash Flow ($000) 120,000,000 608,990,760 360,000,000 540.000,000 180,000,000 300,000,000 420,000,000 600,000,000 720,000,000 644,990,760 572.990.760 680,990,760 1,342.476,900 752,991,200 788,991,200 824,991,200 860,991,200 896,991,200 932,991,200 968,991,200 INVESTMENT SUUMMARY Property Plant and Equipment Working Capital 8% of Sales 5,000,000 400,000,000 320,000,000 SALVAGE SUMMARY Property Less: Clean up costs 5,000,000 300,000 Plant & Equipment Gross Salvage Value 720.000.000 15,000,000 Less: Taxes 40% 600,000 Net Salvage Value ($000) Incremental Cash Flow T-note market premiumbeta Bus Warranty 5 yrs Marcus Warranty 5 Detroit Warranty 1,100 1,500 4,776 CAPM 5.40% 3.00% 5.0% 1.20 18,000 24,513 24,342 1,000 20,000 debt 4.90 % r debt 1 minus tax equity r equity ighted Average Cost of Capital 40.00% 28.00% 72%2 5.40% Net Present Value Internal Rate of Return
Road Kings 2014 Year Year Year Year Year Year Year Year Year Year Year Year Year Year 1 4 Z 10 11 12 13 OPERATING SUMMARY Price per bus 225,500 225,500 225,500 225,500 225,500 225,500 225,500 225,500 225,500 225,500 225,500 225,500 225,500 Units sold 7,750 7,750 7,750 7,750 7,750 7,750 7,750 7,750 7,750 7,750 7,750 7,750 7,750 Revenues 1,747.625,000 1,747.625.000 1,747.625.000 1.747.625.000 1,747.625.000 1,747.625,000 1,747.625.000 1,747.625,000 1,747.625.000 1,747,625.000 1.747.625.000 1,747.625,000 Labor per unit Parts per unit engine Detroit Sales/Administration per year Bus Warranty per unit Engine Warranty per unit Depreciation 52,000 52,000 52,000 52,000 52,000 52,000 52.000 52,000 52,000 52,000 52,000 52,000 52,000 94,000 94,000 94,000 94,000 94,000 94,000 94,000 94,000 94,000 94,000 94,000 94.000 94,000 20,000 155,000,000 155,000,000 155,000,000 155,000,000 155,000,000 155,000,000 155,000,000 155,000,000 155,000,000 155,000,000 155,000,000 155,000,000 250,000,000 250.000.000 250,000,000 250,000,000 250,000,000 250,000.000 250,000,000 250,000,000 250,000,000 250,000,000 250,000,000 250,000,000 250,000,000 0 0 0 0 4.776 1,100 1,100 1,100 1,100 1,100 0 0 0 6.512 1,000 1,000 1,000 1000 1,000 1.000 1.000 1,000 1,000 1.000 1,000 1,000 300,000,000 480.000,000 600.000,000 60,000,000 60.000,000 120,000,000 180,000,000 240,000,000 360,000,000 420,000,000 540,000,000 660,000,000 720,000,000 ЕBIT (5000) 1,282,476,900 1,222,476,900 1,162,476,900 1,102,476,900 1,042,476,900 769,486,140 512.990.760 60,000,000 982.478,000 589,486,800 862,478,000 517,486,800 344,991,200 480,000,000 742,478,000 682,478,000 622,478,000 373,486,800 922,478,000 802,478,000 Taxes 40 % 60% 733.486,140 697,486,140 661.486,140 625,486,140 553,486.800 481,486,800 445.486,800 409.486,800 NOPAT (S000) 296,991,200 272,991,200 660,000,000 488,990,760 464,990,760 440,990,760 1,042,476.900 240.000,000 392,991,200 368,991,200 320,991,200 248,991,200 Add back depreciation Operating Cash Flow ($000) 120,000,000 608,990,760 360,000,000 540.000,000 180,000,000 300,000,000 420,000,000 600,000,000 720,000,000 644,990,760 572.990.760 680,990,760 1,342.476,900 752,991,200 788,991,200 824,991,200 860,991,200 896,991,200 932,991,200 968,991,200 INVESTMENT SUUMMARY Property Plant and Equipment Working Capital 8% of Sales 5,000,000 400,000,000 320,000,000 SALVAGE SUMMARY Property Less: Clean up costs 5,000,000 300,000 Plant & Equipment Gross Salvage Value 720.000.000 15,000,000 Less: Taxes 40% 600,000 Net Salvage Value ($000) Incremental Cash Flow T-note market premiumbeta Bus Warranty 5 yrs Marcus Warranty 5 Detroit Warranty 1,100 1,500 4,776 CAPM 5.40% 3.00% 5.0% 1.20 18,000 24,513 24,342 1,000 20,000 debt 4.90 % r debt 1 minus tax equity r equity ighted Average Cost of Capital 40.00% 28.00% 72%2 5.40% Net Present Value Internal Rate of Return

Chapter5: Operating Activities: Purchases And Cash Payments
Section: Chapter Questions
Problem 4.6C

Related questions

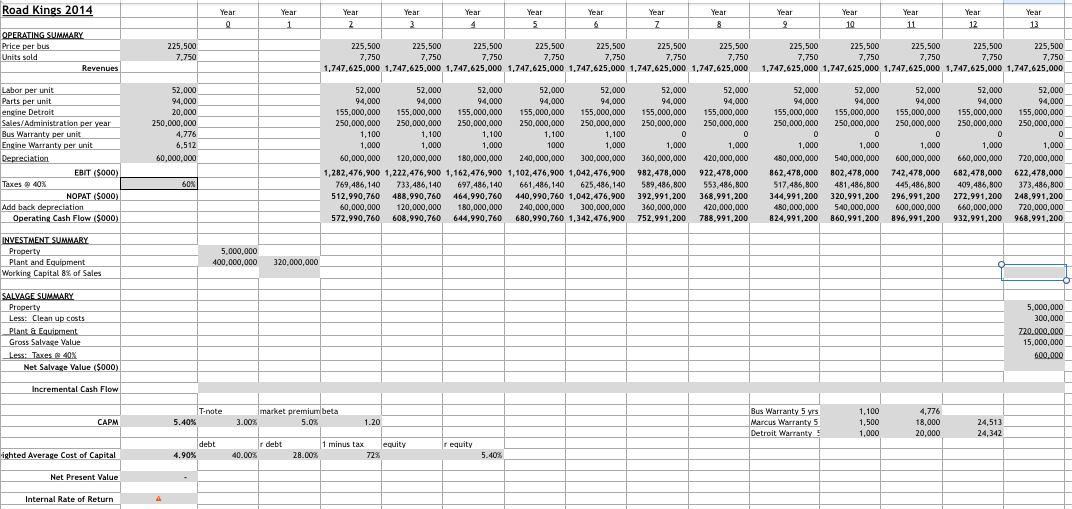
Question
The company will have to allocate funds to net working capital (NWC) for parts inventories equivalent to 8% of annual sales, spent in year 1 and sold off in last year at the end of the project.
Determine the amount of NWC that will be allocated
Transcribed Image Text:Road Kings 2014
Year
Year
Year
Year
Year
Year
Year
Year
Year
Year
Year
Year
Year
Year
1
4
Z
10
11
12
13
OPERATING SUMMARY
Price per bus
225,500
225,500
225,500
225,500
225,500
225,500
225,500
225,500
225,500
225,500
225,500
225,500
225,500
Units sold
7,750
7,750
7,750
7,750
7,750
7,750
7,750
7,750
7,750
7,750
7,750
7,750
7,750
Revenues
1,747.625,000 1,747.625.000 1,747.625.000 1.747.625.000 1,747.625.000 1,747.625,000 1,747.625.000
1,747.625,000 1,747.625.000 1,747,625.000 1.747.625.000 1,747.625,000
Labor per unit
Parts per unit
engine Detroit
Sales/Administration per year
Bus Warranty per unit
Engine Warranty per unit
Depreciation
52,000
52,000
52,000
52,000
52,000
52,000
52.000
52,000
52,000
52,000
52,000
52,000
52,000
94,000
94,000
94,000
94,000
94,000
94,000
94,000
94,000
94,000
94,000
94,000
94.000
94,000
20,000
155,000,000
155,000,000
155,000,000
155,000,000
155,000,000
155,000,000
155,000,000
155,000,000
155,000,000
155,000,000
155,000,000
155,000,000
250,000,000
250.000.000
250,000,000
250,000,000
250,000,000
250,000.000
250,000,000
250,000,000
250,000,000
250,000,000
250,000,000
250,000,000
250,000,000
0
0
0
0
4.776
1,100
1,100
1,100
1,100
1,100
0
0
0
6.512
1,000
1,000
1,000
1000
1,000
1.000
1.000
1,000
1,000
1.000
1,000
1,000
300,000,000
480.000,000
600.000,000
60,000,000
60.000,000
120,000,000
180,000,000
240,000,000
360,000,000
420,000,000
540,000,000
660,000,000
720,000,000
ЕBIT (5000)
1,282,476,900 1,222,476,900 1,162,476,900 1,102,476,900 1,042,476,900
769,486,140
512.990.760
60,000,000
982.478,000
589,486,800
862,478,000
517,486,800
344,991,200
480,000,000
742,478,000
682,478,000
622,478,000
373,486,800
922,478,000
802,478,000
Taxes 40 %
60%
733.486,140
697,486,140
661.486,140
625,486,140
553,486.800
481,486,800
445.486,800
409.486,800
NOPAT (S000)
296,991,200
272,991,200
660,000,000
488,990,760
464,990,760
440,990,760 1,042,476.900
240.000,000
392,991,200
368,991,200
320,991,200
248,991,200
Add back depreciation
Operating Cash Flow ($000)
120,000,000
608,990,760
360,000,000
540.000,000
180,000,000
300,000,000
420,000,000
600,000,000
720,000,000
644,990,760
572.990.760
680,990,760 1,342.476,900
752,991,200
788,991,200
824,991,200 860,991,200
896,991,200
932,991,200
968,991,200
INVESTMENT SUUMMARY
Property
Plant and Equipment
Working Capital 8% of Sales
5,000,000
400,000,000
320,000,000
SALVAGE SUMMARY
Property
Less: Clean up costs
5,000,000
300,000
Plant & Equipment
Gross Salvage Value
720.000.000
15,000,000
Less: Taxes 40%
600,000
Net Salvage Value ($000)
Incremental Cash Flow
T-note
market premiumbeta
Bus Warranty 5 yrs
Marcus Warranty 5
Detroit Warranty
1,100
1,500
4,776
CAPM
5.40%
3.00%
5.0%
1.20
18,000
24,513
24,342
1,000
20,000
debt
4.90 %
r debt
1 minus tax
equity
r equity
ighted Average Cost of Capital
40.00%
28.00%
72%2
5.40%
Net Present Value
Internal Rate of Return
Expert Solution
This question has been solved!
Explore an expertly crafted, step-by-step solution for a thorough understanding of key concepts.

Step by step
Solved in 3 steps with 1 images

Knowledge Booster


Learn more about
Need a deep-dive on the concept behind this application? Look no further. Learn more about this topic, finance and related others by exploring similar questions and additional content below.Recommended textbooks for you

Accounting
Accounting
ISBN:
9781337272094
Author:
WARREN, Carl S., Reeve, James M., Duchac, Jonathan E.
Publisher:
Cengage Learning,
Accounting
Accounting
ISBN:
9781337272094
Author:
WARREN, Carl S., Reeve, James M., Duchac, Jonathan E.
Publisher:
Cengage Learning,