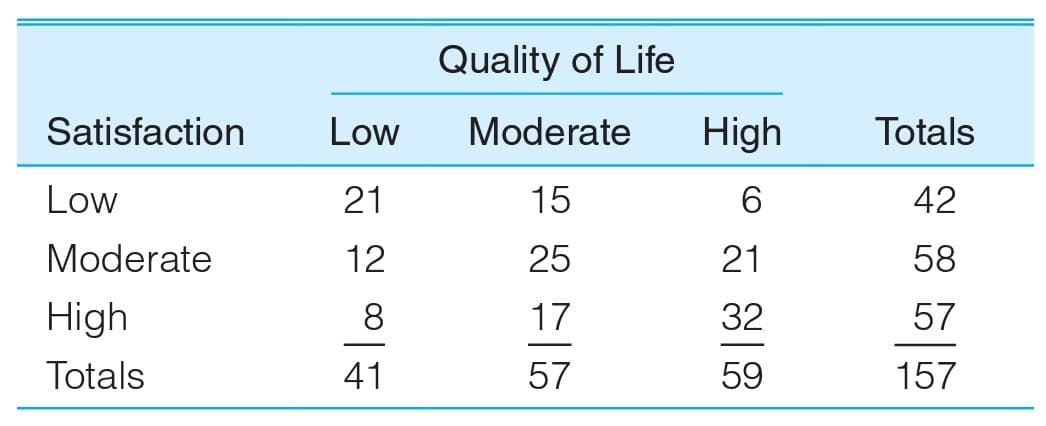
rom Healy textbook Chapter 10: 10.12 ***Go through the 5 steps of significance testing and, if you reject the null, then calculate the column percentages in step five so you can discuss them in your interpretation of the findings. An urban planning commissioner has created a database describing a sample of the neighborhoods in her city and has developed a scale by which each area can be rated for the “quality of life” (this includes measures of pollution, noise, open space, services available, and so on.) She has also asked samples of residents of these areas about their level of satisfaction with their neighborhoods. Is there statistically significant agreement between the commissioner’s objective ratings of quality of life and the respondents’ self-reports of satisfaction? Write a sentence or two explaining your findings, including the results of the chi square test and pattern of column percentages.


From Healy textbook Chapter 10:
10.12
***Go through the 5 steps of significance testing and, if you reject the null, then calculate the column percentages in step five so you can discuss them in your interpretation of the findings.
An urban planning commissioner has created a database describing a sample of the neighborhoods in her city and has developed a scale by which each area can be rated for the “quality of life” (this includes measures of pollution, noise, open space, services available, and so on.) She has also asked samples of residents of these areas about their level of satisfaction with their neighborhoods. Is there statistically significant agreement between the commissioner’s objective ratings of quality of life and the respondents’ self-reports of satisfaction? Write a sentence or two explaining your findings, including the results of the chi square test and pattern of column percentages.


Trending now
This is a popular solution!

Step by step
Solved in 2 steps


