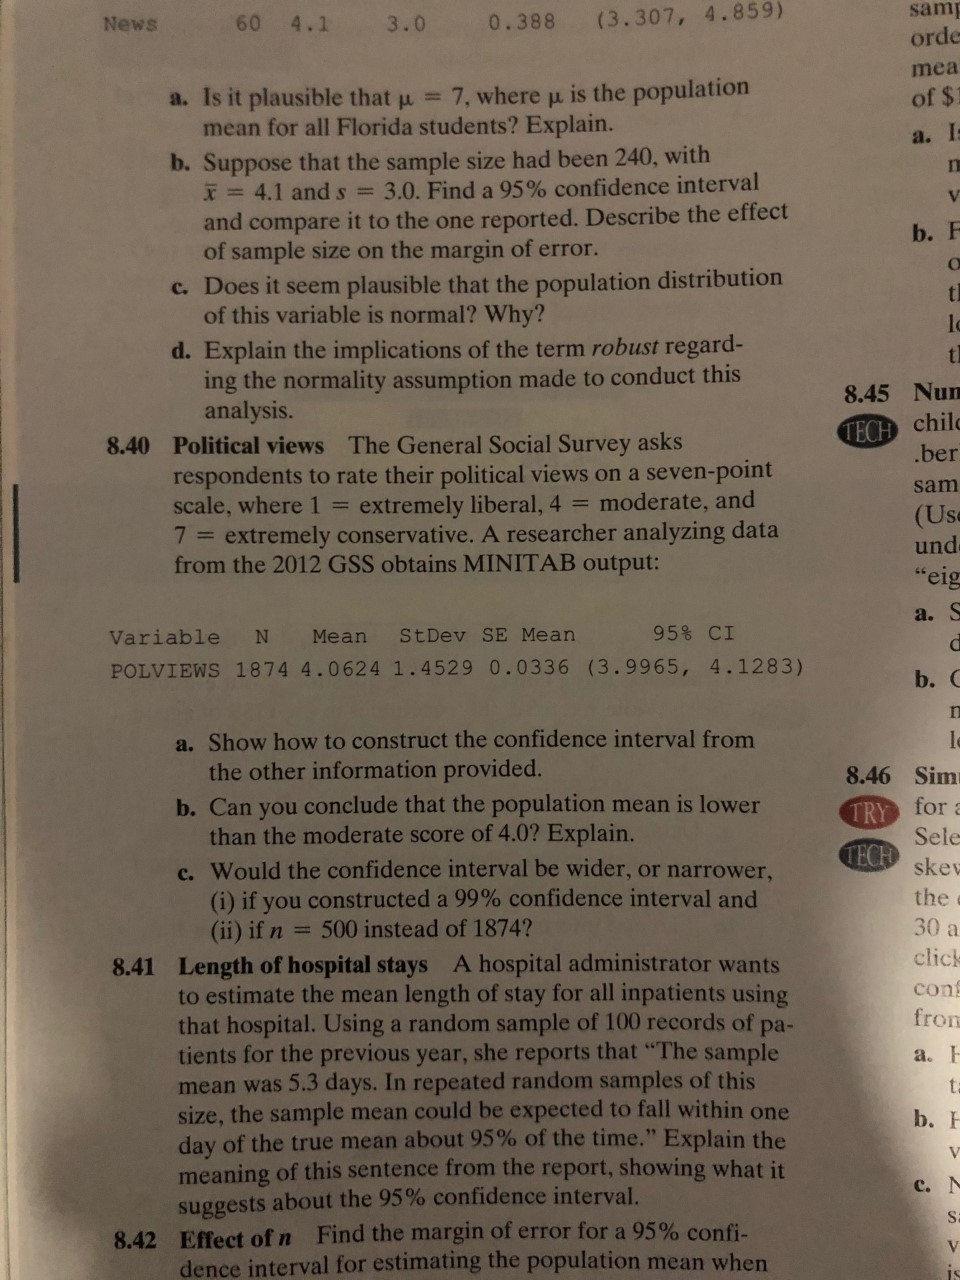
samp orde (3.307, 4.859) 60 0.388 4.1 3.0 News mea = 7, where u is the population a. Is it plausible that u mean for all Florida students? Explain. of $ а. I- b. Suppose that the sample size had been 240, with x=4.1 and s = 3.0. Finda 95% confidence interval and compare it to the one reported. Describe the effect of sample size on the margin of error. V b.F c. Does it seem plausible that the population distribution of this variable is normal? Why? tl lc d. Explain the implications of the term robust regard- ing the normality assumption made to conduct this analysis. t 8.45 Nun chilc СЕСH .ber 8.40 Political views The General Social Survey asks respondents to rate their political views on a seven-point scale, where 1 = sam extremely liberal, 4 = moderate, and (Us und "eig 7= extremely conservative. A researcher analyzing data from the 2012 GSS obtains MINITAB output: a. S 95% CI St Dev SE Mean Variable Mean POLVIEWS 1874 4.0624 1.4529 0.0336 (3.9965, 4.1283) b. C a. Show how to construct the confidence interval from the other information provided. b. Can you conclude that the population mean is lower than the moderate score of 4.0? Explain. c. Would the confidence interval be wider, or narrower, (i) if you constructed a 99% confidence interval and (ii) if n le 8.46 Sim for a TRY Sele TECH skew the 30 a =500 instead of 1874? click 8.41 Length of hospital stays A hospital administrator wants to estimate the mean length of stay for all inpatients using that hospital. Using a random sample of 100 records of pa- tients for the previous year, she reports that "The sample mean was 5.3 days. In repeated random samples of this size, the sample mean could be expected to fall within one day of the true mean about 95% of the time." Explain the meaning of this sentence from the report, showing what it suggests about the 95% confidence interval. 8.42 Effect of n Find the margin of error for a 95% confi- dence interval for estimating the population mean when con from a. t b. H c. N V
samp orde (3.307, 4.859) 60 0.388 4.1 3.0 News mea = 7, where u is the population a. Is it plausible that u mean for all Florida students? Explain. of $ а. I- b. Suppose that the sample size had been 240, with x=4.1 and s = 3.0. Finda 95% confidence interval and compare it to the one reported. Describe the effect of sample size on the margin of error. V b.F c. Does it seem plausible that the population distribution of this variable is normal? Why? tl lc d. Explain the implications of the term robust regard- ing the normality assumption made to conduct this analysis. t 8.45 Nun chilc СЕСH .ber 8.40 Political views The General Social Survey asks respondents to rate their political views on a seven-point scale, where 1 = sam extremely liberal, 4 = moderate, and (Us und "eig 7= extremely conservative. A researcher analyzing data from the 2012 GSS obtains MINITAB output: a. S 95% CI St Dev SE Mean Variable Mean POLVIEWS 1874 4.0624 1.4529 0.0336 (3.9965, 4.1283) b. C a. Show how to construct the confidence interval from the other information provided. b. Can you conclude that the population mean is lower than the moderate score of 4.0? Explain. c. Would the confidence interval be wider, or narrower, (i) if you constructed a 99% confidence interval and (ii) if n le 8.46 Sim for a TRY Sele TECH skew the 30 a =500 instead of 1874? click 8.41 Length of hospital stays A hospital administrator wants to estimate the mean length of stay for all inpatients using that hospital. Using a random sample of 100 records of pa- tients for the previous year, she reports that "The sample mean was 5.3 days. In repeated random samples of this size, the sample mean could be expected to fall within one day of the true mean about 95% of the time." Explain the meaning of this sentence from the report, showing what it suggests about the 95% confidence interval. 8.42 Effect of n Find the margin of error for a 95% confi- dence interval for estimating the population mean when con from a. t b. H c. N V

Glencoe Algebra 1, Student Edition, 9780079039897, 0079039898, 2018
18th Edition
ISBN:9780079039897
Author:Carter
Publisher:Carter
Chapter10: Statistics
Section10.4: Distributions Of Data
Problem 19PFA

Related questions

Topic Video
Question
8.40
Transcribed Image Text:samp
orde
(3.307, 4.859)
60
0.388
4.1
3.0
News
mea
= 7, where u is the population
a. Is it plausible that u
mean for all Florida students? Explain.
of $
а. I-
b. Suppose that the sample size had been 240, with
x=4.1 and s = 3.0. Finda 95% confidence interval
and compare it to the one reported. Describe the effect
of sample size on the margin of error.
V
b.F
c. Does it seem plausible that the population distribution
of this variable is normal? Why?
tl
lc
d. Explain the implications of the term robust regard-
ing the normality assumption made to conduct this
analysis.
t
8.45 Nun
chilc
СЕСH
.ber
8.40 Political views The General Social Survey asks
respondents to rate their political views on a seven-point
scale, where 1 =
sam
extremely liberal, 4 = moderate, and
(Us
und
"eig
7= extremely conservative. A researcher analyzing data
from the 2012 GSS obtains MINITAB output:
a. S
95% CI
St Dev SE Mean
Variable
Mean
POLVIEWS 1874 4.0624 1.4529 0.0336 (3.9965, 4.1283)
b. C
a. Show how to construct the confidence interval from
the other information provided.
b. Can you conclude that the population mean is lower
than the moderate score of 4.0? Explain.
c. Would the confidence interval be wider, or narrower,
(i) if you constructed a 99% confidence interval and
(ii) if n
le
8.46 Sim
for a
TRY
Sele
TECH
skew
the
30 a
=500 instead of 1874?
click
8.41 Length of hospital stays A hospital administrator wants
to estimate the mean length of stay for all inpatients using
that hospital. Using a random sample of 100 records of pa-
tients for the previous year, she reports that "The sample
mean was 5.3 days. In repeated random samples of this
size, the sample mean could be expected to fall within one
day of the true mean about 95% of the time." Explain the
meaning of this sentence from the report, showing what it
suggests about the 95% confidence interval.
8.42 Effect of n Find the margin of error for a 95% confi-
dence interval for estimating the population mean when
con
from
a.
t
b. H
c. N
V
Expert Solution
This question has been solved!
Explore an expertly crafted, step-by-step solution for a thorough understanding of key concepts.

This is a popular solution!

Trending now
This is a popular solution!

Step by step
Solved in 2 steps with 2 images

Knowledge Booster


Learn more about
Need a deep-dive on the concept behind this application? Look no further. Learn more about this topic, statistics and related others by exploring similar questions and additional content below.Recommended textbooks for you
Glencoe Algebra 1, Student Edition, 9780079039897…
Algebra
ISBN:
9780079039897
Author:
Carter
Publisher:
McGraw Hill
Glencoe Algebra 1, Student Edition, 9780079039897…
Algebra
ISBN:
9780079039897
Author:
Carter
Publisher:
McGraw Hill