sample data 4.9 goal sample size sample mean 0.75 25 4.372 5 or< 10.5 3.2 7.7 0.1875 0.0075 0.0866 2.3 3.2 9.5 6.7 5.5 standard error of the proportion Wait times less than 5 18 sample proportion 0.72 0.5 2.3 z score 0.35 Managers at a local phone service wireless retail center have a goal that 75% of the center's customers will have to wait less than five minutes for service. The data below shows the wait times of a random sample of 25 customers in minutes. Does this sample provide evidence that management's goal is being achieved? 3.3 2.3 4.5
sample data 4.9 goal sample size sample mean 0.75 25 4.372 5 or< 10.5 3.2 7.7 0.1875 0.0075 0.0866 2.3 3.2 9.5 6.7 5.5 standard error of the proportion Wait times less than 5 18 sample proportion 0.72 0.5 2.3 z score 0.35 Managers at a local phone service wireless retail center have a goal that 75% of the center's customers will have to wait less than five minutes for service. The data below shows the wait times of a random sample of 25 customers in minutes. Does this sample provide evidence that management's goal is being achieved? 3.3 2.3 4.5

Big Ideas Math A Bridge To Success Algebra 1: Student Edition 2015
1st Edition
ISBN:9781680331141
Author:HOUGHTON MIFFLIN HARCOURT
Publisher:HOUGHTON MIFFLIN HARCOURT
Chapter11: Data Analysis And Displays
Section11.3: Shapes Of Distributions
Problem 20E

Related questions

Question
I am stuck on the question below. I have been able to figure out everything down to the last part. I am to use Excel in the assignment.
I know that I will be using the excel formula norm.dist(x,mean,standarddeviation,true)
but I am having issues with plugging in the data correctly in the formula .. please assist ensuring to show me what should be plugged into the excel formula
Transcribed Image Text:sample data
4.9
goal
sample size
sample mean
0.75
25
4.372
5 or<
10.5
3.2
7.7
0.1875
0.0075
0.0866
2.3
3.2
9.5
6.7
5.5
standard error of the proportion
Wait times less than 5
18
sample proportion
0.72
0.5
2.3
z score
0.35
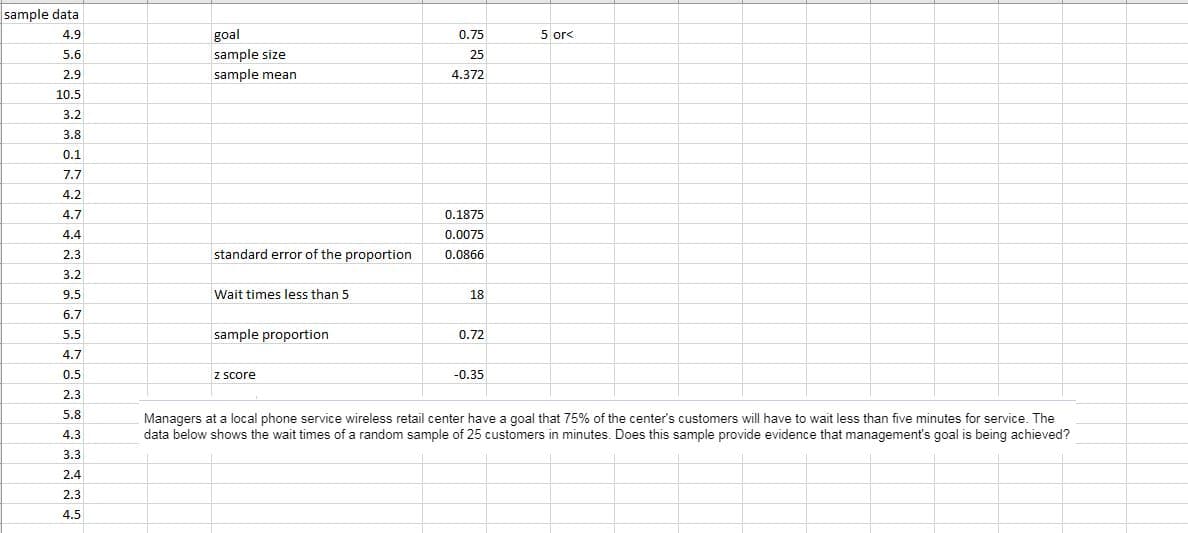
Managers at a local phone service wireless retail center have a goal that 75% of the center's customers will have to wait less than five minutes for service. The
data below shows the wait times of a random sample of 25 customers in minutes. Does this sample provide evidence that management's goal is being achieved?
3.3
2.3
4.5
Expert Solution
This question has been solved!
Explore an expertly crafted, step-by-step solution for a thorough understanding of key concepts.

This is a popular solution!

Trending now
This is a popular solution!

Step by step
Solved in 7 steps with 3 images

Knowledge Booster


Learn more about
Need a deep-dive on the concept behind this application? Look no further. Learn more about this topic, statistics and related others by exploring similar questions and additional content below.Recommended textbooks for you
Big Ideas Math A Bridge To Success Algebra 1: Stu…
Algebra
ISBN:
9781680331141
Author:
HOUGHTON MIFFLIN HARCOURT
Publisher:
Houghton Mifflin Harcourt
Big Ideas Math A Bridge To Success Algebra 1: Stu…
Algebra
ISBN:
9781680331141
Author:
HOUGHTON MIFFLIN HARCOURT
Publisher:
Houghton Mifflin Harcourt