Select a significance level α and reject the null-hypothesis if the p-value is less than α. Explain, in complete sentences, your findings: Is there a statistically significant association (at α level) between the provided genes? What is the magnitude and the direction of the association?
Select a significance level α and reject the null-hypothesis if the p-value is less than α. Explain, in complete sentences, your findings: Is there a statistically significant association (at α level) between the provided genes? What is the magnitude and the direction of the association?

Big Ideas Math A Bridge To Success Algebra 1: Student Edition 2015
1st Edition
ISBN:9781680331141
Author:HOUGHTON MIFFLIN HARCOURT
Publisher:HOUGHTON MIFFLIN HARCOURT
Chapter4: Writing Linear Equations
Section: Chapter Questions
Problem 14CR

Related questions
Question
Select a significance level α and reject the null-hypothesis if the p-value is less than α. Explain, in complete sentences, your findings: Is there a statistically significant association (at α level) between the provided genes? What is the magnitude and the direction of the association?
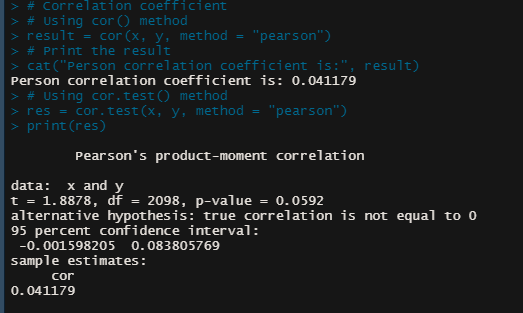
Transcribed Image Text:> # correlation coefficient
> # Using cor () method
> result = cor (x, y, method
> # Print the result
cat ("Person correlation coefficient is:", result)
Person correlation coefficient is: 0.041179
"pearson")
> # Using cor.test() method
> res = cor.test(x, y, method = "pearson")
> print (res)
Pearson's product-moment correlation
data: x and y
t = 1. 8878, df = 2098, p-value = 0.0592
alternative hypothes is: true correlation is not equal to o
95 percent confidence interval:
-0. 001598205 0.083805769
sample estimates:
cor
0.041179
Expert Solution
This question has been solved!
Explore an expertly crafted, step-by-step solution for a thorough understanding of key concepts.

Step by step
Solved in 2 steps with 1 images

Recommended textbooks for you
Big Ideas Math A Bridge To Success Algebra 1: Stu…
Algebra
ISBN:
9781680331141
Author:
HOUGHTON MIFFLIN HARCOURT
Publisher:
Houghton Mifflin Harcourt
Big Ideas Math A Bridge To Success Algebra 1: Stu…
Algebra
ISBN:
9781680331141
Author:
HOUGHTON MIFFLIN HARCOURT
Publisher:
Houghton Mifflin Harcourt