Sherwin Williams sells paints in hardware stores across the U.S. The company maintains a large sales force who call on existing customers and look for new business. The sales manager is investigating the relationship between the # of sales calls made and the miles driven by sales representatives. Also, do the sales representatives who drive the most miles and make the most calls necessarily earn the most in sales comissions? To investigate, the VP selected a sample of 25 sales representatives and determined:


Contingency Table
A contingency table can be defined as the visual representation of the relationship between two or more categorical variables that can be evaluated and registered. It is a categorical version of the scatterplot, which is used to investigate the linear relationship between two variables. A contingency table is indeed a type of frequency distribution table that displays two variables at the same time.
Binomial Distribution
Binomial is an algebraic expression of the sum or the difference of two terms. Before knowing about binomial distribution, we must know about the binomial theorem.
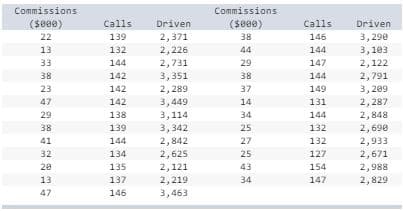
Sherwin Williams sells paints in hardware stores across the U.S. The company maintains a large sales force who call on existing customers and look for new business. The sales manager is investigating the relationship between the # of sales calls made and the miles driven by sales representatives. Also, do the sales representatives who drive the most miles and make the most calls necessarily earn the most in sales comissions? To investigate, the VP selected a sample of 25 sales representatives and determined:
The amount earned in comissions last month (y) ; The number of miles driven last month (x1) ; The number of sales calls made last month (x2)
*See attached for information
- Develop a regression equation including an interaction term. (round to 3 decimal places)
Comissions = ? + ? Calls + ? Miles + ? x1x2
- Complete the following table:
| Predictor | Coefficient | SE Coefficient | t | p-value |
| Constant | ||||
| Calls | ||||
| Miles | ||||
| X1X2 |
- Compute the value of the test statistic corresponding to the interaction term (round to 2 decimal places)


Step by step
Solved in 3 steps with 3 images


