Shown below is the PV-diagram for a clockwise cycle. Determine the work done during the cycle, the heat flow during the cycle, & the change in internal energy during the cycle. P(N/m²) 10 8 6 + 2 P(N/m²) 10 8 2 6 N Part 2: Circle Shown below is the PV-diagram for a counterclockwise cycle. Determine the work done during the cycle, the heat flow during the cycle, & the change in internal energy during the cycle. Submit Answer 6 00 V (m³) 10 8 10 W = V (m³) AU = OJ 11 J 3 O W = X Q= AU = OJ
Shown below is the PV-diagram for a clockwise cycle. Determine the work done during the cycle, the heat flow during the cycle, & the change in internal energy during the cycle. P(N/m²) 10 8 6 + 2 P(N/m²) 10 8 2 6 N Part 2: Circle Shown below is the PV-diagram for a counterclockwise cycle. Determine the work done during the cycle, the heat flow during the cycle, & the change in internal energy during the cycle. Submit Answer 6 00 V (m³) 10 8 10 W = V (m³) AU = OJ 11 J 3 O W = X Q= AU = OJ

Related questions
Question
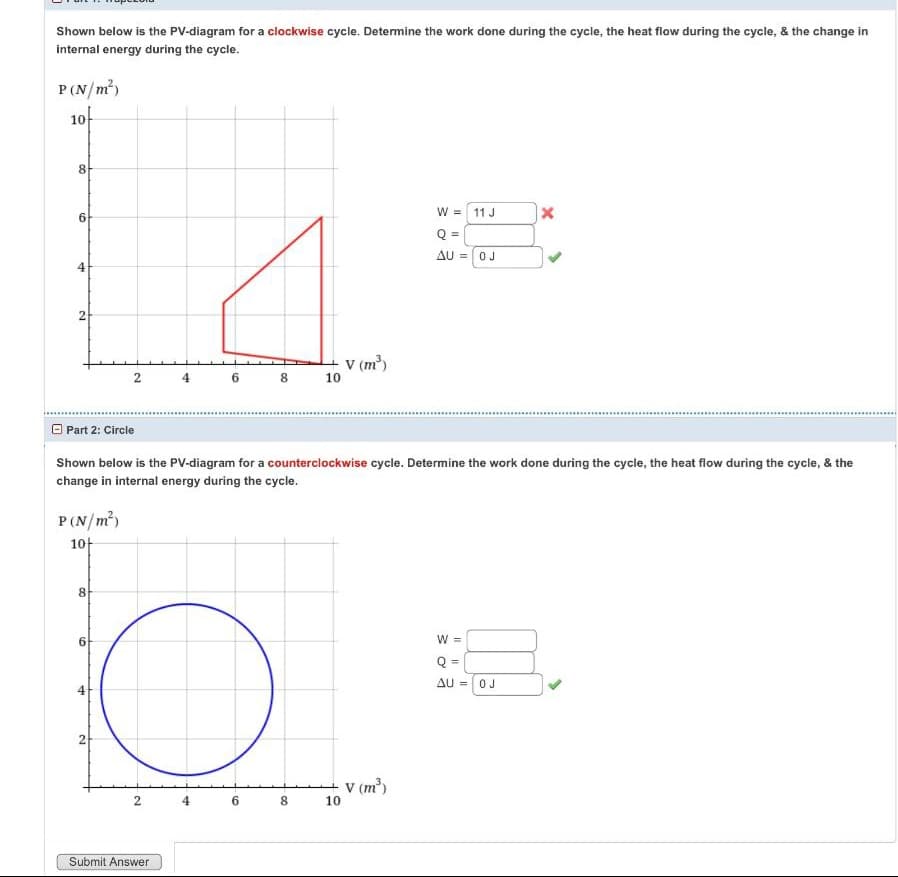
Transcribed Image Text:Shown below is the PV-diagram for a clockwise cycle. Determine the work done during the cycle, the heat flow during the cycle, & the change in
internal energy during the cycle.
P(N/m²)
10
8
6
4
2
P(N/m²)
10+
8
6
4
2
2
Part 2: Circle
Shown below is the PV-diagram for a counterclockwise cycle. Determine the work done during the cycle, the heat flow during the cycle, & the
change in internal energy during the cycle.
2
Submit Answer
6
4
8
6
10
00
V (m³)
10
W = 11 J
Q =
AU = 0 J
V (m³)
W =
Q =
AU =
X
OJ
Expert Solution
This question has been solved!
Explore an expertly crafted, step-by-step solution for a thorough understanding of key concepts.

This is a popular solution!

Trending now
This is a popular solution!

Step by step
Solved in 2 steps with 2 images
