solated bacteria from the sputum of a patient that seemed somewhat resistant to their antibiotic ce multiple weeks of treatment had yielded no satisfactory improvement of their active disease. er had then resuspended the patient's sputum in saline and used a mouse model to measure the a phage selected for its capacity to target M. mycobacterium, as a single therapy, and as a herapy with antibiotics. Here is a schematic representation of the experiment: Group 1 Control (saline) oculate mice th patient utum Group 2 wait for active disease to show Treated with phage Collect lung sample every 2 weeks Group 3 Treated with Abx Split mice showing active disease in 4 Group 4 Treated with Abx and Count bacteria in sample groups phage itum from patients were isolated and resuspended in saline. Mice were given equal amounts of sputum intra-nasally and were left to develop active disease. Once the mice developed active were split into 4 group: a control group treated with saline (group 1), a group treated with the e only (group 2), a group treated with antibiotics (Abx) only (group 3) and a group treated with both eriophage (group 4). Group 1 was injected with saline (i.v.) every week, to mimic the treatment oup 2 was given a single dose of bacteriophage on day one of active disease, Group3 was treated every week, and Group 4 was treated with one dose of bacteriophage on day 1 of active disease oses of Abx. Once the 4 treatments started, several mice from each group were culled every 2 weeks , and their lung lavage were collected to count the number of bacteria growing on agar plates with esults from this experiment that Ahmed presented at the lab meeting: Control Figure 5. Bacterial growth in mice model of tuberculosis. Mice were inoculated with the same number of M.tuberculosis and treatment with control (saline), Abx, phage, or Abx with phage started at onset of active disease. Mice lung lavage (sputum samples) were collected Abx and phage
solated bacteria from the sputum of a patient that seemed somewhat resistant to their antibiotic ce multiple weeks of treatment had yielded no satisfactory improvement of their active disease. er had then resuspended the patient's sputum in saline and used a mouse model to measure the a phage selected for its capacity to target M. mycobacterium, as a single therapy, and as a herapy with antibiotics. Here is a schematic representation of the experiment: Group 1 Control (saline) oculate mice th patient utum Group 2 wait for active disease to show Treated with phage Collect lung sample every 2 weeks Group 3 Treated with Abx Split mice showing active disease in 4 Group 4 Treated with Abx and Count bacteria in sample groups phage itum from patients were isolated and resuspended in saline. Mice were given equal amounts of sputum intra-nasally and were left to develop active disease. Once the mice developed active were split into 4 group: a control group treated with saline (group 1), a group treated with the e only (group 2), a group treated with antibiotics (Abx) only (group 3) and a group treated with both eriophage (group 4). Group 1 was injected with saline (i.v.) every week, to mimic the treatment oup 2 was given a single dose of bacteriophage on day one of active disease, Group3 was treated every week, and Group 4 was treated with one dose of bacteriophage on day 1 of active disease oses of Abx. Once the 4 treatments started, several mice from each group were culled every 2 weeks , and their lung lavage were collected to count the number of bacteria growing on agar plates with esults from this experiment that Ahmed presented at the lab meeting: Control Figure 5. Bacterial growth in mice model of tuberculosis. Mice were inoculated with the same number of M.tuberculosis and treatment with control (saline), Abx, phage, or Abx with phage started at onset of active disease. Mice lung lavage (sputum samples) were collected Abx and phage

Biology: The Dynamic Science (MindTap Course List)
4th Edition
ISBN:9781305389892
Author:Peter J. Russell, Paul E. Hertz, Beverly McMillan
Publisher:Peter J. Russell, Paul E. Hertz, Beverly McMillan
Chapter17: Bacterial And Viral Genetics
Section: Chapter Questions
Problem 1ITD

Related questions

Question
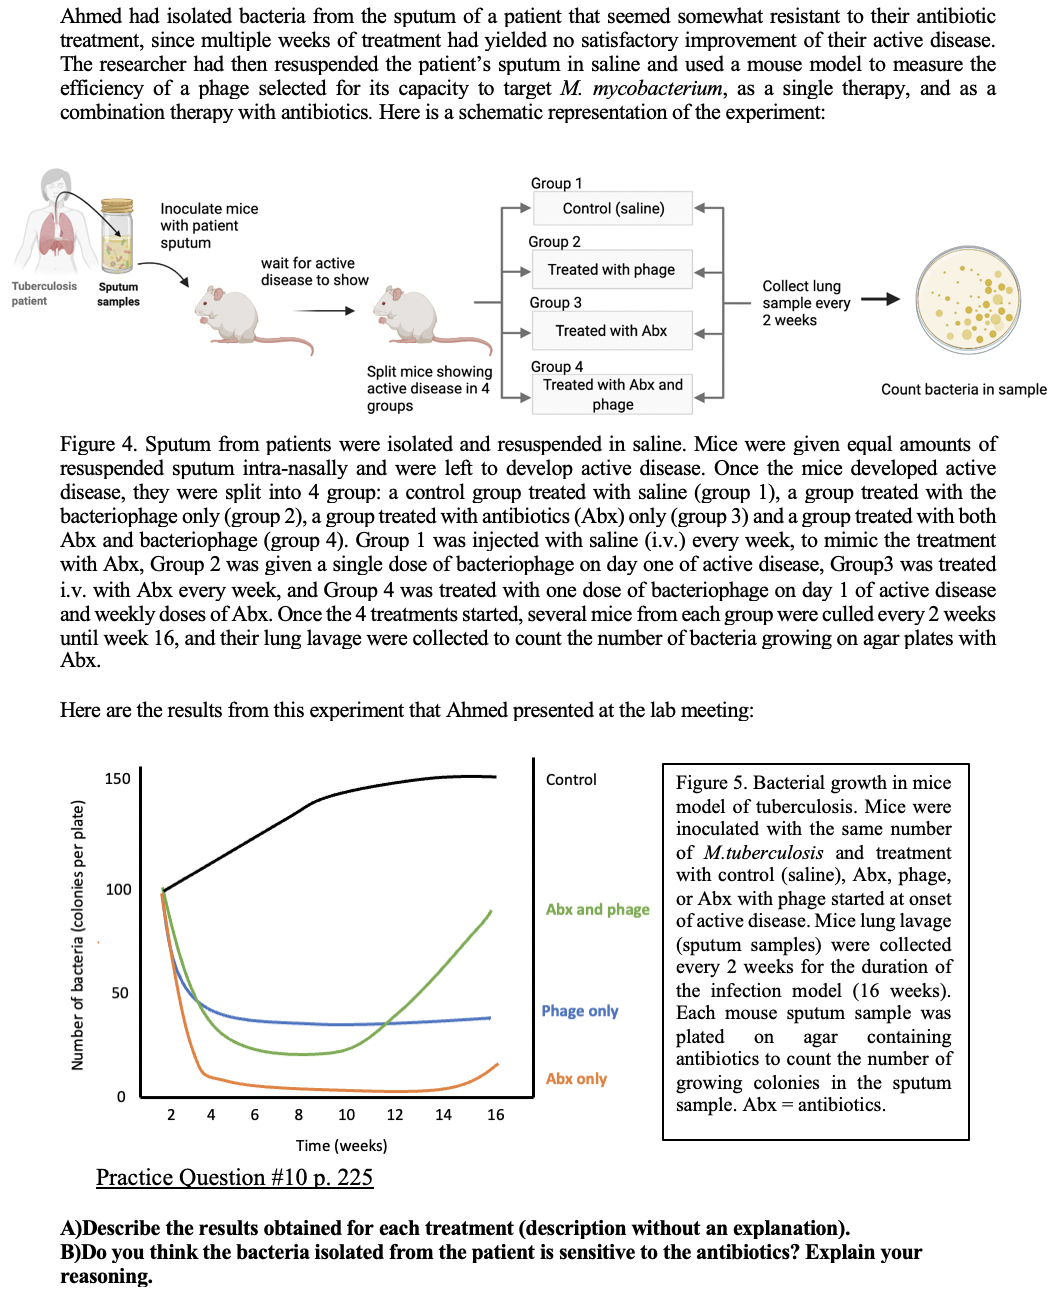
Transcribed Image Text:Ahmed had isolated bacteria from the sputum of a patient that seemed somewhat resistant to their antibiotic
treatment, since multiple weeks of treatment had yielded no satisfactory improvement of their active disease.
The researcher had then resuspended the patient's sputum in saline and used a mouse model to measure the
efficiency of a phage selected for its capacity to target M. mycobacterium, as a single therapy, and as a
combination therapy with antibiotics. Here is a schematic representation of the experiment:
Group 1
Control (saline)
Inoculate mice
with patient
sputum
Group 2
wait for active
disease to show
Treated with phage
Sputum
samples
Collect lung
sample every
2 weeks
Tuberculosis
patient
Group 3
Treated with Abx
Split mice showing
active disease in 4
Group 4
Treated with Abx and
Count bacteria in sample
groups
phage
Figure 4. Sputum from patients were isolated and resuspended in saline. Mice were given equal amounts of
resuspended sputum intra-nasally and were left to develop active disease. Once the mice developed active
disease, they were split into 4 group: a control group treated with saline (group 1), a group treated with the
bacteriophage only (group 2), a group treated with antibiotics (Abx) only (group 3) and a group treated with both
Abx and bacteriophage (group 4). Group 1 was injected with saline (i.v.) every week, to mimic the treatment
with Abx, Group 2 was given a single dose of bacteriophage on day one of active disease, Group3 was treated
i.v. with Abx every week, and Group 4 was treated with one dose of bacteriophage on day 1 of active disease
and weekly doses of Abx. Once the 4 treatments started, several mice from each group were culled every 2 weeks
until week 16, and their lung lavage were collected to count the number of bacteria growing on agar plates with
Abx.
Here are the results from this experiment that Ahmed presented at the lab meeting:
150
Control
Figure 5. Bacterial growth in mice
model of tuberculosis. Mice were
inoculated with the same number
of M.tuberculosis and treatment
with control (saline), Abx, phage,
or Abx with phage started at onset
of active disease. Mice lung lavage
(sputum samples) were collected
every 2 weeks for the duration of
the infection model (16 weeks).
Each mouse sputum sample was
plated
antibiotics to count the number of
100
Abx and phage
50
Phage only
agar
containing
on
Abx only
growing colonies in the sputum
sample. Abx = antibiotics.
2
6
8
10
12
14
16
Time (weeks)
Practice Question #10 p. 225
A)Describe the results obtained for each treatment (description without an explanation).
B)Do you think the bacteria isolated from the patient is sensitive to the antibiotics? Explain your
reasoning.
Number of bacteria (colonies per plate)
Expert Solution
This question has been solved!
Explore an expertly crafted, step-by-step solution for a thorough understanding of key concepts.

Step by step
Solved in 2 steps

Knowledge Booster


Learn more about
Need a deep-dive on the concept behind this application? Look no further. Learn more about this topic, biology and related others by exploring similar questions and additional content below.Recommended textbooks for you
Biology: The Dynamic Science (MindTap Course List)
Biology
ISBN:
9781305389892
Author:
Peter J. Russell, Paul E. Hertz, Beverly McMillan
Publisher:
Cengage Learning
Biology: The Dynamic Science (MindTap Course List)
Biology
ISBN:
9781305389892
Author:
Peter J. Russell, Paul E. Hertz, Beverly McMillan
Publisher:
Cengage Learning