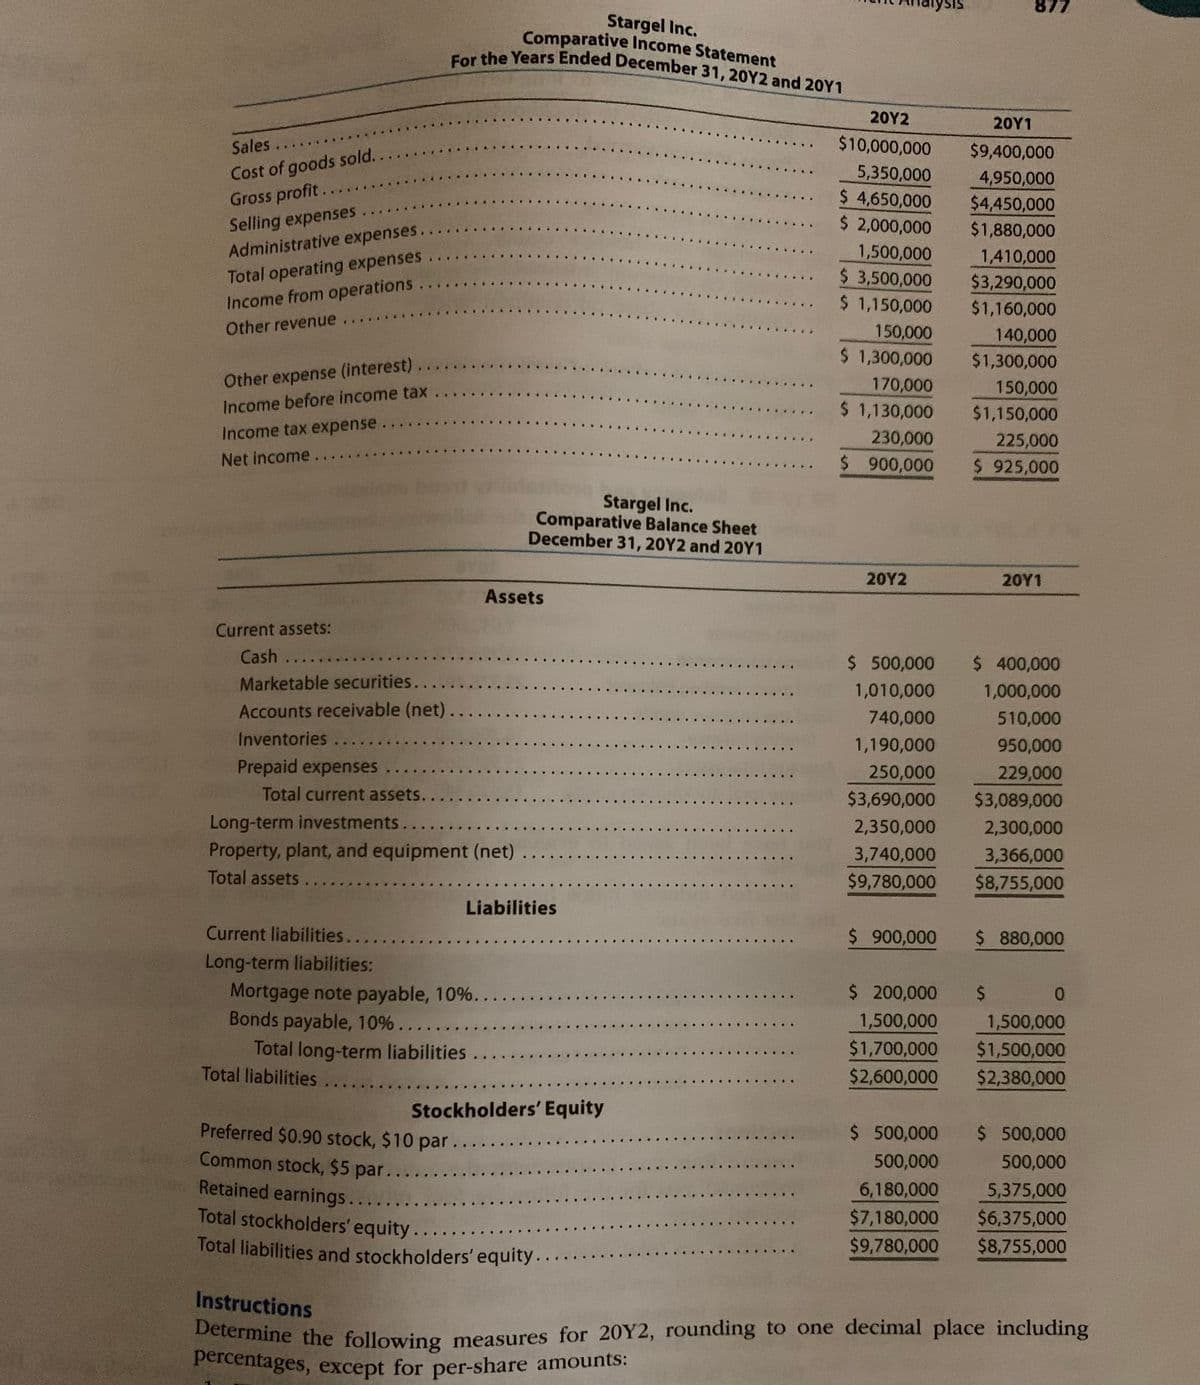
Stargel Inc. Comparative Income Statement the Years Ended December 31, 20Y2 and 20Y1 20Y2 20Υ1 Sales $10,000,000 $9,400,000 Cost of goods sold.. Gross profit Selling expenses Administrative expenses. 5,350,000 4,950,000 $ 4,650,000 $ 2,000,000 $4,450,000 $1,880,000 Total operating expenses Income from operations 1,500,000 $ 3,500,000 $ 1,150,000 1,410,000 $3,290,000 $1,160,000 Other revenue 150,000 140,000 $ 1,300,000 $1,300,000 Other expense (interest) Income before income tax 170,000 150,000 $ 1,130,000 $1,150,000 Income tax expense... 230,000 225,000 Net income $ 900,000 $ 925,000 Stargel Inc. Comparative Balance Sheet December 31, 20Y2 and 20Y1 20Υ2 20Υ1 Assets Current assets: Cash $ 500,000 $ 400,000 Marketable securities.. Accounts receivable (net). 1,010,000 1,000,000 740,000 510,000 Inventories 1,190,000 950,000 Prepaid expenses 250,000 229,000 $3,089,000 Total current assets.. $3,690,000 Long-term investments. Property, plant, and equipment (net) Total assets 2,350,000 2,300,000 3,740,000 3,366,000 $8,755,000 $9,780,000 Liabilities Current liabilities.. $ 900,000 $ 880,000 Long-term liabilities: Mortgage note payable, 10%. Bonds payable, 10%... Total long-term liabilities Total liabilities $ 200,000 %24 1,500,000 1,500,000 $1,700,000 $2,600,000 $1,500,000 $2,380,000 Stockholders' Equity Preferred $0.90 stock, $10 par Common stock, $5 par. $ 500,000 $ 500,000 500,000 500,000 Retained earnings.. Total stockholders' equity. 6,180,000 5,375,000 $6,375,000 $7,180,000 Total liabilities and stockholders' equity. $9,780,000 $8,755,000 Instructions etermine the following measures for 20Y2, rounding to one decimal place including percentages, except for per-share amounts:
Stargel Inc. Comparative Income Statement the Years Ended December 31, 20Y2 and 20Y1 20Y2 20Υ1 Sales $10,000,000 $9,400,000 Cost of goods sold.. Gross profit Selling expenses Administrative expenses. 5,350,000 4,950,000 $ 4,650,000 $ 2,000,000 $4,450,000 $1,880,000 Total operating expenses Income from operations 1,500,000 $ 3,500,000 $ 1,150,000 1,410,000 $3,290,000 $1,160,000 Other revenue 150,000 140,000 $ 1,300,000 $1,300,000 Other expense (interest) Income before income tax 170,000 150,000 $ 1,130,000 $1,150,000 Income tax expense... 230,000 225,000 Net income $ 900,000 $ 925,000 Stargel Inc. Comparative Balance Sheet December 31, 20Y2 and 20Y1 20Υ2 20Υ1 Assets Current assets: Cash $ 500,000 $ 400,000 Marketable securities.. Accounts receivable (net). 1,010,000 1,000,000 740,000 510,000 Inventories 1,190,000 950,000 Prepaid expenses 250,000 229,000 $3,089,000 Total current assets.. $3,690,000 Long-term investments. Property, plant, and equipment (net) Total assets 2,350,000 2,300,000 3,740,000 3,366,000 $8,755,000 $9,780,000 Liabilities Current liabilities.. $ 900,000 $ 880,000 Long-term liabilities: Mortgage note payable, 10%. Bonds payable, 10%... Total long-term liabilities Total liabilities $ 200,000 %24 1,500,000 1,500,000 $1,700,000 $2,600,000 $1,500,000 $2,380,000 Stockholders' Equity Preferred $0.90 stock, $10 par Common stock, $5 par. $ 500,000 $ 500,000 500,000 500,000 Retained earnings.. Total stockholders' equity. 6,180,000 5,375,000 $6,375,000 $7,180,000 Total liabilities and stockholders' equity. $9,780,000 $8,755,000 Instructions etermine the following measures for 20Y2, rounding to one decimal place including percentages, except for per-share amounts:

Accounting (Text Only)
26th Edition
ISBN:9781285743615
Author:Carl Warren, James M. Reeve, Jonathan Duchac
Publisher:Carl Warren, James M. Reeve, Jonathan Duchac
Chapter17: Financial Statement Analysis
Section: Chapter Questions
Problem 17.17EX: Profitability ratios The following selected data were taken from the financial statements of...

Related questions
Question
I uploaded pictures for problem 17-4B.
I am trying to figure out the
3. Quick Ratio
| 4. | Accounts receivable | |
| turnover | ||
| 5. | Number of days' | |
| sales in receivables | ||
| 6. | Inventory turnover | |
| 7. | Number of days' | |
| sales in inventory |
8. Ratio of Fixed Assets to long-term Liabilities
9. Ratio of Liabilities to
10. Times interest earned
11. Asset Turnover
13. Return on Stockholders Equity
14. Return on Common Stockhholders Equity
15. Earnings per share on Common stock
16. Price Earnings Ratio
17. Dividends per share of Common Stock
| 18. | Dividend yield |
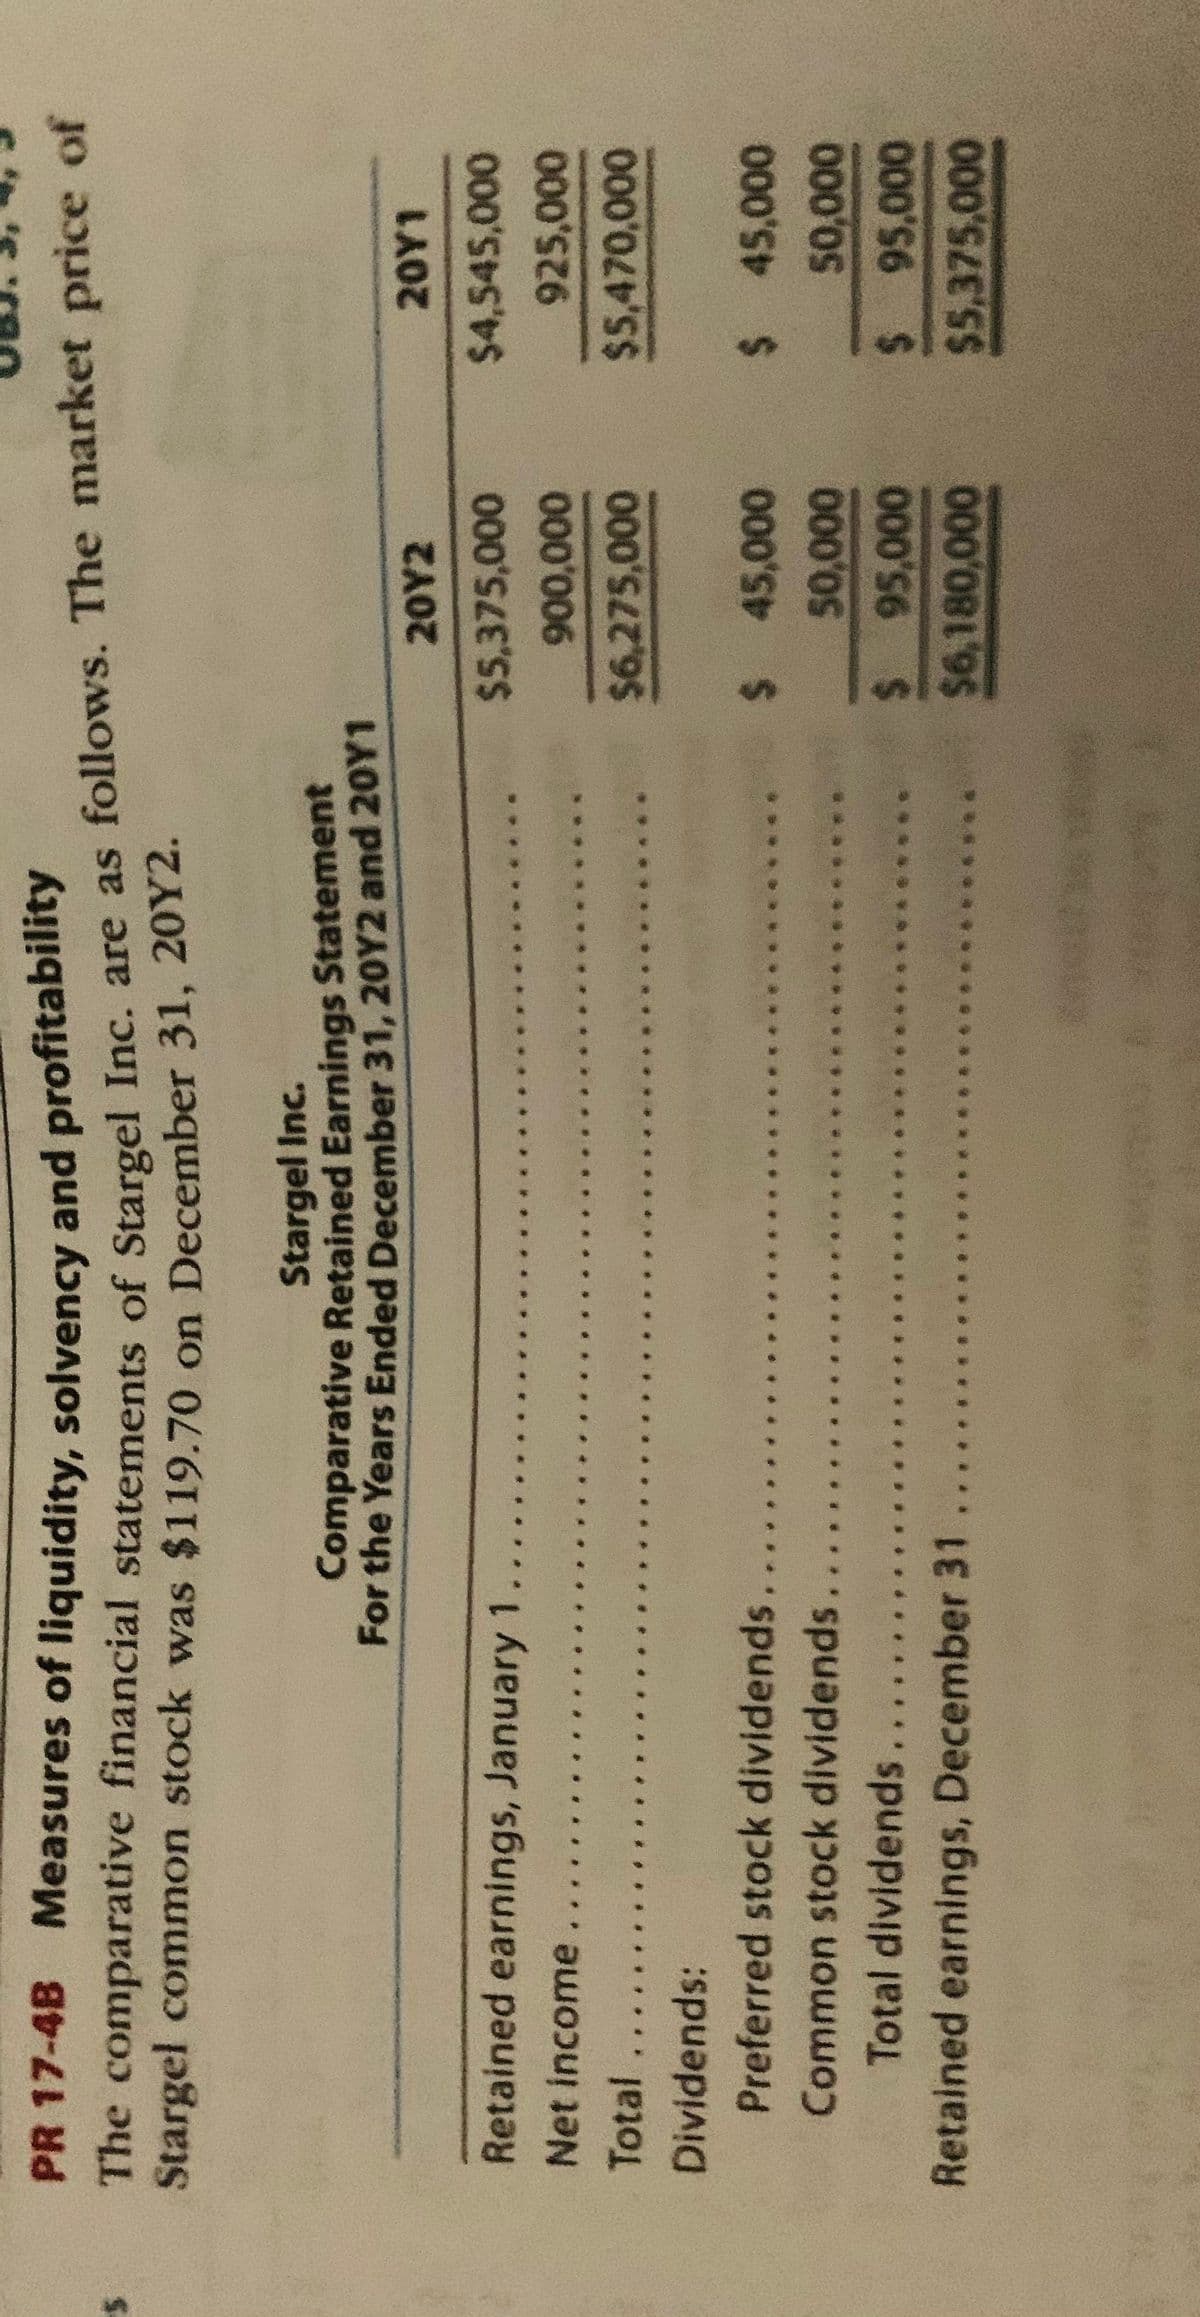
Transcribed Image Text:PR 17-4B Measures of liquidity, solvency and profitability
The comparative financial statements of Stargel Inc are as follows. The market price of
Stargel common stock was $119.70 on December 31, 20Y2.
Stargel Inc.
Comparative Retained Earnings Statement
For the Years Ended December 31, 20Y2 and 20Y1
20Y2
20Y1
Retained earnings, January 1
$5,375,000
$4,545,000
Net income
925,000
Total...
$6,275,000
$5,470,000
Dividends:
Preferred stock dividends
$ 45,000
Common stock dividends
Total dividends
Retained earnings, December 31
$6,180,000
$5,375,000
Transcribed Image Text:percentages, except for per-share amounts:
877
Stargel Inc.
Comparative Income Statement
ar the Years Ended December 31, 20Y2 and 20Y1
20Υ2
20Υ1
Sales
$10,000,000
$9,400,000
Cost of goods sold..
Gross profit.
5,350,000
$ 4,650,000
$ 2,000,000
4,950,000
$4,450,000
Selling expenses
Administrative expenses.
$1,880,000
1,500,000
1,410,000
Total operating expenses
Income from operations
Other revenue...
$ 3,500,000
$ 1,150,000
$3,290,000
$1,160,000
150,000
140,000
$ 1,300,000
$1,300,000
Other expense (interest)
Income before income tax
170,000
150,000
$1,150,000
$ 1,130,000
Income tax expense.
230,000
225,000
Net income
$ 9.00,000
$ 925,000
Stargel Inc.
Comparative Balance Sheet
December 31, 20Y2 and 20Y1
20Υ2
20Υ1
Assets
Current assets:
Cash
$ 500,000
$ 400,000
Marketable securities.
1,010,000
1,000,000
Accounts receivable (net).
740,000
510,000
Inventories
1,190,000
950,000
Prepaid expenses
Total current assets..
250,000
229,000
$3,690,000
$3,089,000
Long-term investments..
Property, plant, and equipment (net)
2,350,000
2,300,000
3,740,000
3,366,000
Total assets
$9,780,000
$8,755,000
Liabilities
Current liabilities.
$ 900,000
$ 880,000
Long-term liabilities:
Mortgage note payable, 10%.
Bonds payable, 10%..
Total long-term liabilities
Total liabilities
$ 200,000
$
01
1,500,000
1,500,000
$1,700,000
$1,500,000
$2,600,000
$2,380,000
Stockholders' Equity
Preferred $0.90 stock, $10 par...
Common stock, $5 par.
Retained earnings..
$ 500,000
$ 500,000
500,000
500,000
6,180,000
5,375,000
Total stockholders' equity
$7,180,000
$6,375,000
Total liabilities and stockholders' equity.
$9,780,000
$8,755,000
Instructions
Determine the following measures for 20Y2, rounding to one decimal place including
Expert Solution
This question has been solved!
Explore an expertly crafted, step-by-step solution for a thorough understanding of key concepts.

This is a popular solution!

Trending now
This is a popular solution!

Step by step
Solved in 2 steps

Knowledge Booster


Learn more about
Need a deep-dive on the concept behind this application? Look no further. Learn more about this topic, accounting and related others by exploring similar questions and additional content below.Recommended textbooks for you
Accounting (Text Only)
Accounting
ISBN:
9781285743615
Author:
Carl Warren, James M. Reeve, Jonathan Duchac
Publisher:
Cengage Learning

Corporate Financial Accounting
Accounting
ISBN:
9781337398169
Author:
Carl Warren, Jeff Jones
Publisher:
Cengage Learning

Financial & Managerial Accounting
Accounting
ISBN:
9781337119207
Author:
Carl Warren, James M. Reeve, Jonathan Duchac
Publisher:
Cengage Learning
Accounting (Text Only)
Accounting
ISBN:
9781285743615
Author:
Carl Warren, James M. Reeve, Jonathan Duchac
Publisher:
Cengage Learning
Corporate Financial Accounting
Accounting
ISBN:
9781337398169
Author:
Carl Warren, Jeff Jones
Publisher:
Cengage Learning
Financial & Managerial Accounting
Accounting
ISBN:
9781337119207
Author:
Carl Warren, James M. Reeve, Jonathan Duchac
Publisher:
Cengage Learning

Corporate Financial Accounting
Accounting
ISBN:
9781305653535
Author:
Carl Warren, James M. Reeve, Jonathan Duchac
Publisher:
Cengage Learning

Accounting
Accounting
ISBN:
9781337272094
Author:
WARREN, Carl S., Reeve, James M., Duchac, Jonathan E.
Publisher:
Cengage Learning,

Financial & Managerial Accounting
Accounting
ISBN:
9781285866307
Author:
Carl Warren, James M. Reeve, Jonathan Duchac
Publisher:
Cengage Learning