The following graph displays four demand curves (LL, MM, NN, and 00) that intersect at point A. 200 180 180 M 140 E 120 100 80 60 M 40 20 20 40 60 80 100 120 140 180 180 200 QUANTITY (Units) PRICE (Dollars per unit) B.
The following graph displays four demand curves (LL, MM, NN, and 00) that intersect at point A. 200 180 180 M 140 E 120 100 80 60 M 40 20 20 40 60 80 100 120 140 180 180 200 QUANTITY (Units) PRICE (Dollars per unit) B.

Chapter5: Price Elasticity Of Demand And Supply
Section: Chapter Questions
Problem 18SQ

Related questions

Question
i need help getting this question right from macroecon question 4
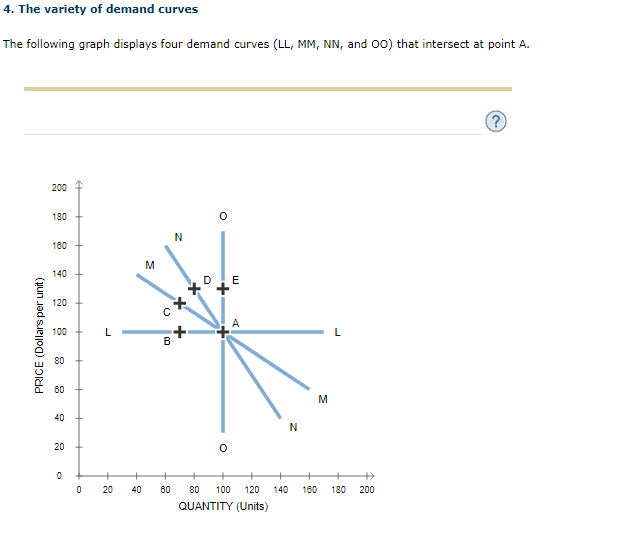
Transcribed Image Text:The following graph displays four demand curves (LL, MM, NN, and 00) that intersect at point A.
200
180
180
M
140
E
120
100
80
60
M
40
20
20
40
60
80
100
120
140
180
180
200
QUANTITY (Units)
PRICE (Dollars per unit)
B.
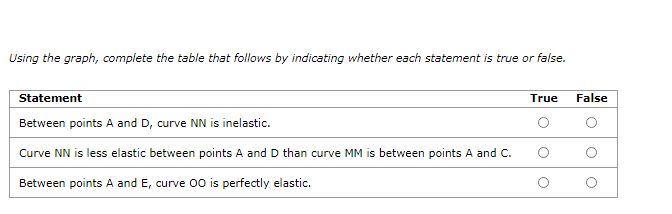
Transcribed Image Text:Statement
True
False
Between points A and D, curve NN is inelastic.
Curve NN is less elastic between points A and D than curve MM is between points A and C.
Between points A and E, curve 00 is perfectly elastic.
Expert Solution
This question has been solved!
Explore an expertly crafted, step-by-step solution for a thorough understanding of key concepts.

This is a popular solution!

Trending now
This is a popular solution!

Step by step
Solved in 2 steps

Knowledge Booster


Learn more about
Need a deep-dive on the concept behind this application? Look no further. Learn more about this topic, economics and related others by exploring similar questions and additional content below.Recommended textbooks for you


Economics (MindTap Course List)
Economics
ISBN:
9781337617383
Author:
Roger A. Arnold
Publisher:
Cengage Learning