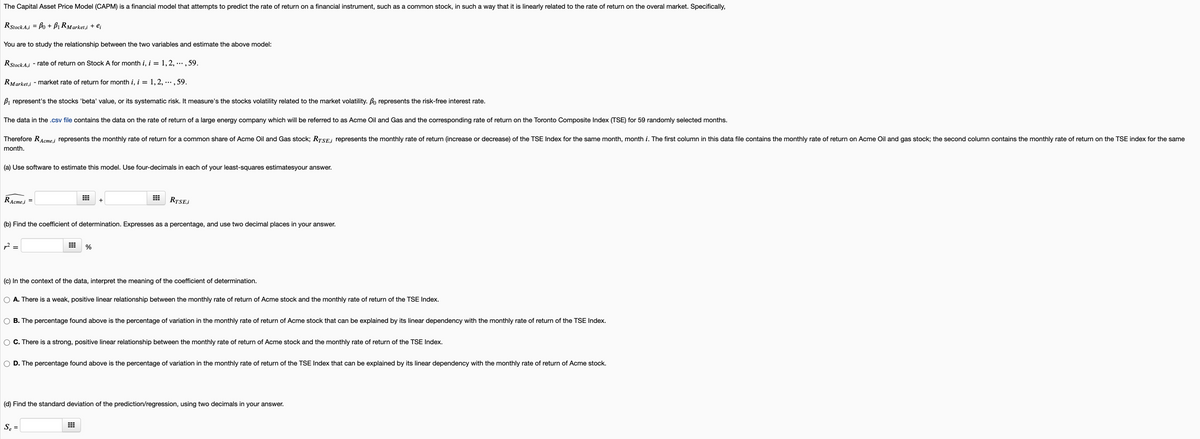
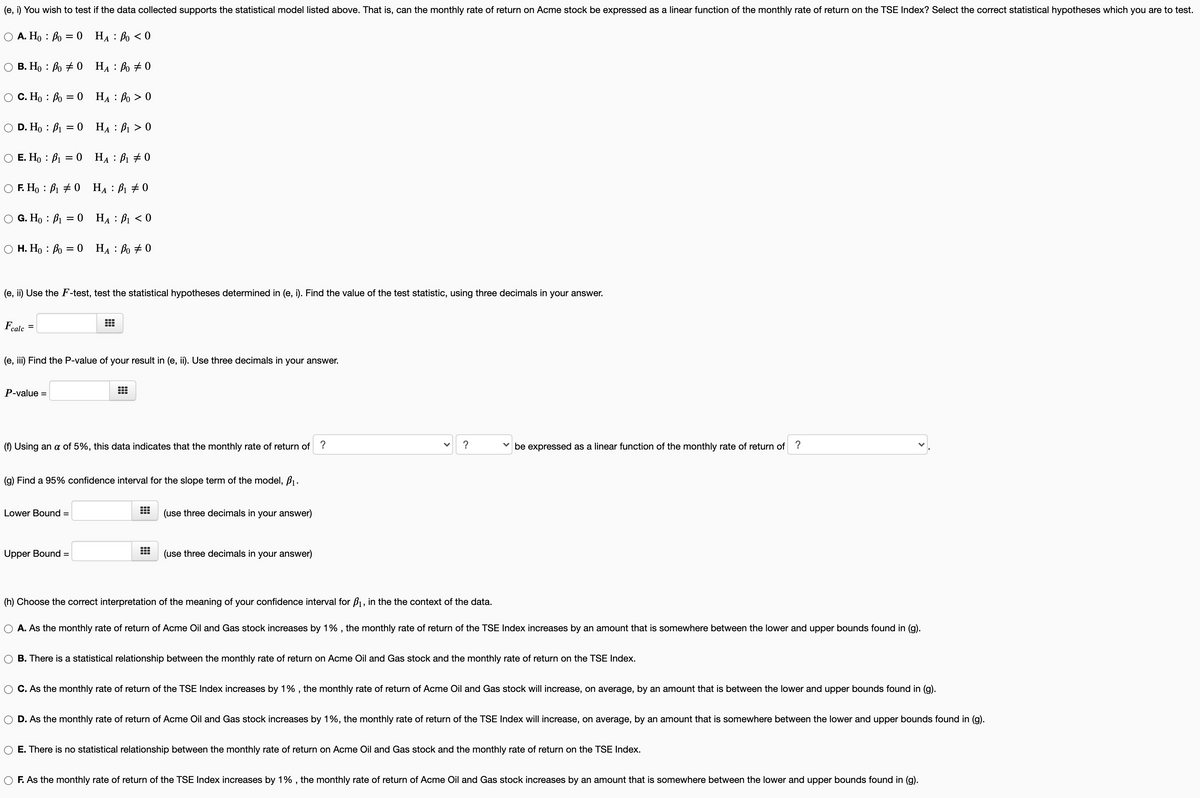
The Capital Asset Price Model (CAPM) is a financial model that attempts to predict the rate of return on a financial instrument, such as a common stock, in such a way that it is linearly related to the rate of return on the overal market. Specifically, RStock A.i = Bo + Bị RMarket,i + e; You are to study the relationship between the two variables and estimate the above model: RStockA.i - rate of return on Stock A for month i, i = 1,2, ... , 59. RMarket.i - market rate of return for month i, i = 1, 2, ·.., 59. B1 represent's the stocks 'beta' value, or its systematic risk. It measure's the stocks volatility related to the market volatility. Bo represents the risk-free interest rate. The data in the .csv file contains the data on the rate of return of a large energy company which will be referred to as Acme Oil and Gas and the corresponding rate of return on the Toronto Composite Index (TSE) for 59 randomly selected months. Therefore RAcme.i represents the monthly rate of return for a common share of Acme Oil and Gas stock; RTSE.i represents the monthly rate of return (increase or decrease) of the TSE Index for the same month, month i. The first column in this data file contains the monthly rate of return on Acme Oil and gas stock; the second column contains the monthly rate of return on the TSE index for the same month. (a) Use software to estimate this model. Use four-decimals in each of your least-squares estimatesyour answer. RAcme,i RTSE,i %D + (b) Find the coefficient of determination. Expresses as a percentage, and use two decimal places in your answer. (c) In the context of the data, interpret the meaning of the coefficient of determination. O A. There is a weak, positive linear relationship between the monthly rate of return of Acme stock and the monthly rate of return of the TSE Index. B. The percentage found above is the percentage of variation in the monthly rate of return of Acme stock that can be explained by its linear dependency with the monthly rate of return of the TSE Index. C. There is a strong, positive linear relationship between the monthly rate of return of Acme stock and the monthly rate of return of the TSE Index. D. The percentage found above is the percentage of variation in the monthly rate of return of the TSE Index that can be explained by its linear dependency with the monthly rate of return of Acme stock. (d) Find the standard deviation of the prediction/regression, using two decimals in your answer. Se = (e, i) You wish to test if the data collected supports the statistical model listed above. That is, can the monthly rate of return on Acme stock be expressed as a linear function of the monthly rate of return on the TSE Index? Select the correct statistical hypotheses which you are to test. O A. Ho : Bo = 0 HẠ : Bo < 0 В. Но : Во + 0 На : Во +0 С. Но : Во 0 HA : Bo > 0 D. Ho : B1 = 0 HẠ: B1 > 0 E. H, : B1 = 0 HẠ : B1 # 0 F. H, : B1 # 0 HẠ : B1 # 0 А G. H, : B1 = 0 HẠ : B1 < 0 O H. Ho : fo = 0 HẠ : Bo + 0 %3D (e, ii) Use the F-test, test the statistical hypotheses determined in (e, i). Find the value of the test statistic, using three decimals in your answer. Fcalc %3D (e, iii) Find the P-value of your result in (e, ii). Use three decimals in your answer. P-value = (f) Using an a of 5%, this data indicates that the monthly rate of return of ? v be expressed as a linear function of the monthly rate of return of ? (g) Find a 95% confidence interval for the slope term of the model, B1. Lower Bound = (use three decimals in your answer) Upper Bound (use three decimals in your answer) %3D (h) Choose the correct interpretation of the meaning of your confidence interval for B1, in the the context of the data. A. As the monthly rate of return of Acme Oil and Gas stock increases by 1% , the monthly rate of return of the TSE Index increases by an amount that is somewhere between the lower and upper bounds found in (g). B. There is a statistical relationship between the monthly rate of return on Acme Oil and Gas stock and the monthly rate of return on the TSE Index. C. As the monthly rate of return of the TSE Index increases by 1% , the monthly rate of return of Acme Oil and Gas stock will increase, on average, by an amount that is between the lower and upper bounds found in (g). D. As the monthly rate of return of Acme Oil and Gas stock increases by 1%, the monthly rate of return of the TSE Index will increase, on average, by an amount that is somewhere between the lower and upper bounds found in (g). E. There is no statistical relationship between the monthly rate of return on Acme Oil and Gas stock and the monthly rate of return on the TSE Index. F. As the monthly rate of return of the TSE Index increases by 1% , the monthly rate of return of Acme Oil and Gas stock increases by an amount that is somewhere between the lower and upper bounds found in (g). > >


Please help. Thank you. CSV file data is below.
|
TSERofReturn |
AcmeRofReturn |
|
-1.99167 |
-1.03712 |
|
2.64815 |
3.04528 |
|
-0.58856 |
0.44802 |
|
-0.76395 |
0.60781 |
|
-0.81178 |
2.51735 |
|
-0.14212 |
1.70972 |
|
0.17677 |
-0.27609 |
|
0.54349 |
1.18672 |
|
-0.09428 |
0.49632 |
|
0.3681 |
-3.08347 |
|
0.60727 |
1.4182 |
|
1.3726 |
0.1878 |
|
-0.8915 |
-1.81699 |
|
1.8031 |
0.975 |
|
-0.26967 |
1.85853 |
|
2.42493 |
2.33005 |
|
-0.95528 |
-0.48742 |
|
-0.28562 |
-0.15591 |
|
-2.13517 |
-1.67924 |
|
-0.85961 |
1.57905 |
|
1.0856 |
-4.09194 |
|
-1.06689 |
-0.43368 |
|
0.04922 |
1.22281 |
|
3.2381 |
-0.55675 |
|
1.05371 |
-0.23124 |
|
-1.1785 |
-5.10525 |
|
1.11749 |
0.5909 |
|
-0.01456 |
1.70857 |
|
1.13344 |
0.93883 |
|
2.6641 |
0.92507 |
|
-1.33795 |
0.9294 |
|
-1.65683 |
-1.93668 |
|
-2.21489 |
-5.10648 |
|
-1.19445 |
0.47456 |
|
-0.461 |
0.19373 |
|
0.6551 |
-0.44915 |
|
1.5161 |
-1.11084 |
|
3.42943 |
2.58471 |
|
-0.3175 |
1.17337 |
|
-0.47695 |
-1.08238 |
|
-1.13067 |
3.70155 |
|
-0.77989 |
-0.43626 |
|
1.0856 |
1.73033 |
|
-0.15806 |
0.24375 |
|
0.01733 |
1.2231 |
|
-0.76395 |
1.5149 |
|
0.03327 |
-0.98149 |
|
-0.44506 |
-0.049 |
|
-0.66828 |
-0.23686 |
|
-1.59306 |
0.29884 |
|
1.96254 |
1.20561 |
|
1.99443 |
1.24752 |
|
0.6551 |
-2.03129 |
|
-2.15111 |
-1.98497 |
|
1.03777 |
-1.61283 |
|
-2.58161 |
-4.48088 |
|
-0.461 |
1.26959 |
|
-0.66828 |
1.09214 |
|
-1.035 |
-0.45506 |


Trending now
This is a popular solution!

Step by step
Solved in 5 steps with 5 images


