Stocks may be categorized by sectors. The accompanying data represent the one-year rate of return (in percent) for a sample of consumer cyclical stocks and industrial stocks for a 12-month period. Note: Consumer cyclical stocks include restaurants and retailers. Industrial stocks include manufacturers and shipping companies. Complete parts (a) through (c) below. E Click the icon to view the data. (b) Determine the mean and median rate of return for each sector. Which sector has the higher mean rate of return? Which sector has the higher median rate of return? Xconsumer cyclical = Mconsumer cyclical = (Round to three decimal places as needed.)
Stocks may be categorized by sectors. The accompanying data represent the one-year rate of return (in percent) for a sample of consumer cyclical stocks and industrial stocks for a 12-month period. Note: Consumer cyclical stocks include restaurants and retailers. Industrial stocks include manufacturers and shipping companies. Complete parts (a) through (c) below. E Click the icon to view the data. (b) Determine the mean and median rate of return for each sector. Which sector has the higher mean rate of return? Which sector has the higher median rate of return? Xconsumer cyclical = Mconsumer cyclical = (Round to three decimal places as needed.)

Glencoe Algebra 1, Student Edition, 9780079039897, 0079039898, 2018
18th Edition
ISBN:9780079039897
Author:Carter
Publisher:Carter
Chapter10: Statistics
Section10.6: Summarizing Categorical Data
Problem 4BGP

Related questions
Question
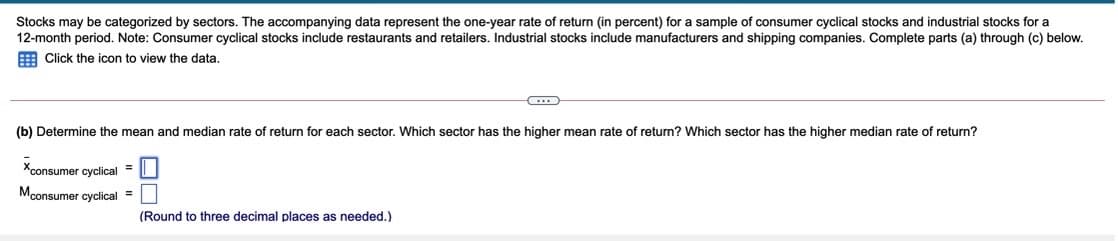
Transcribed Image Text:Stocks may be categorized by sectors. The accompanying data represent the one-year rate of return (in percent) for a sample of consumer cyclical stocks and industrial stocks for a
12-month period. Note: Consumer cyclical stocks include restaurants and retailers. Industrial stocks include manufacturers and shipping companies. Complete parts (a) through (c) below.
E Click the icon to view the data.
(b) Determine the mean and median rate of return for each sector. Which sector has the higher mean rate of return? Which sector has the higher median rate of return?
Xconsumer cyclical =
Mconsumer cyclical =
(Round to three decimal places as needed.)
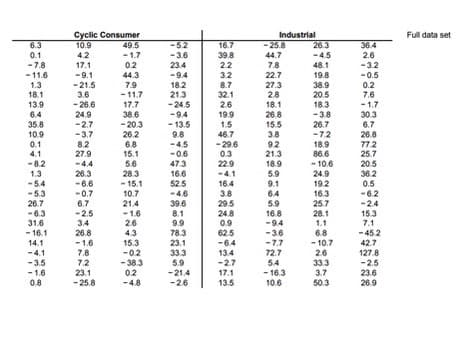
Transcribed Image Text:Cyclic Consumer
49.5
10.9
Industrial
Full data set
6.3
-5.2
16.7
-25.8
26.3
36.4
0.1
4.2
-1.7
-3.6
39.8
22
44.7
-4.5
2.6
-7.8
17.1
02
23.4
7.8
22.7
48.1
-3.2
- 11.6
1.3
-9.1
44.3
7.9
- 11.7
17.7
38.6
-9.4
3.2
19.8
-0.5
-21.5
3.6
- 26.6
24.9
-2.7
-3.7
8.2
27.9
18.2
21.3
-24.5
-94
18.1
13.9
6.4
35.8
10.9
0.1
8.7
32.1
2.6
19.9
1.5
46.7
- 29.6
0.3
229
27.3
2.8
18.1
26.8
15.5
3.8
38.9
20.5
18.3
-3.8
26.7
-72
18.9
86.6
- 10.6
0.2
7.6
-1.7
30.3
6.7
26.8
772
25.7
- 20.3
26.2
6.8
15.1
5.6
28.3
- 15.1
10.7
21.4
-1.6
2.6
4.3
15.3
- 13.5
9.8
-4.5
-0.6
47.3
16.6
52.5
-4.6
39.6
8.1
9.9
78.3
23.1
33.3
5.9
-21.4
-26
9.2
21.3
18.9
5.9
9.1
64
5.9
4.1
-8.2
-4.4
20.5
36.2
0.5
-6.2
-2.4
15.3
26.3
-6.6
1.3
-54
- 5.3
26.7
-6.3
31.6
24.9
19.2
16.3
25.7
28.1
-4.1
-0.7
6.7
-2.5
16.4
3.8
29.5
24.8
0.9
62.5
-6.4
13.4
-2.7
17.1
13.5
16.8
-94
3.4
1.1
26.8
- 1.6
7.8
7.1
- 45.2
42.7
- 16.1
-36
6.8
-7.7
72.7
54
- 16.3
10.6
14.1
- 10.7
26
33.3
3.7
-0.2
- 38.3
127.8
-2.5
23.6
26.9
-4.1
-3.5
- 1.6
0.8
7.2
23.1
-25.8
02
-4.8
50.3
Expert Solution
This question has been solved!
Explore an expertly crafted, step-by-step solution for a thorough understanding of key concepts.

This is a popular solution!

Trending now
This is a popular solution!

Step by step
Solved in 2 steps with 10 images

Recommended textbooks for you
Glencoe Algebra 1, Student Edition, 9780079039897…
Algebra
ISBN:
9780079039897
Author:
Carter
Publisher:
McGraw Hill

Big Ideas Math A Bridge To Success Algebra 1: Stu…
Algebra
ISBN:
9781680331141
Author:
HOUGHTON MIFFLIN HARCOURT
Publisher:
Houghton Mifflin Harcourt
Glencoe Algebra 1, Student Edition, 9780079039897…
Algebra
ISBN:
9780079039897
Author:
Carter
Publisher:
McGraw Hill
Big Ideas Math A Bridge To Success Algebra 1: Stu…
Algebra
ISBN:
9781680331141
Author:
HOUGHTON MIFFLIN HARCOURT
Publisher:
Houghton Mifflin Harcourt