Strain mm/mm graph above shows the stress-strain relationship of a steel bar under tension The steel bar diameter = 8 mm and the bar gauge length = 100 mm. Determine following: e specimen is loaded to 550 MPa and then unloaded. What would be the lulus of resilience of the sample after reloading?
Strain mm/mm graph above shows the stress-strain relationship of a steel bar under tension The steel bar diameter = 8 mm and the bar gauge length = 100 mm. Determine following: e specimen is loaded to 550 MPa and then unloaded. What would be the lulus of resilience of the sample after reloading?

Elements Of Electromagnetics
7th Edition
ISBN:9780190698614
Author:Sadiku, Matthew N. O.
Publisher:Sadiku, Matthew N. O.
ChapterMA: Math Assessment
Section: Chapter Questions
Problem 1.1MA

Related questions
Question
Transcribed Image Text:650
600
550
500
450
400
350
300
250
200
150
100
50
0.002
0.004
0.006
0.008
0.01
0.012
0.014
0.016
0.018
0.02
Strain mm/mm
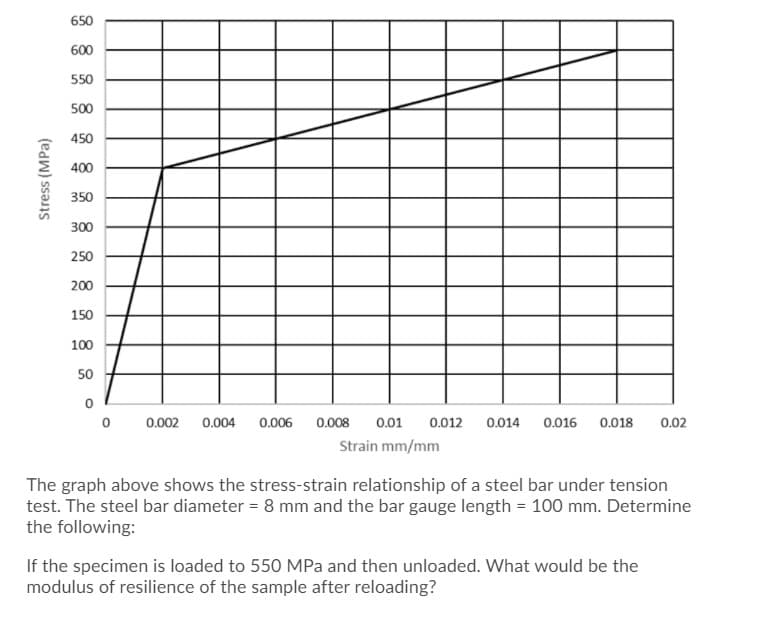
The graph above shows the stress-strain relationship of a steel bar under tension
test. The steel bar diameter = 8 mm and the bar gauge length = 100 mm. Determine
the following:
If the specimen is loaded to 550 MPa and then unloaded. What would be the
modulus of resilience of the sample after reloading?
Stress (MPa)
Expert Solution
This question has been solved!
Explore an expertly crafted, step-by-step solution for a thorough understanding of key concepts.

Step by step
Solved in 2 steps with 2 images

Recommended textbooks for you
Elements Of Electromagnetics
Mechanical Engineering
ISBN:
9780190698614
Author:
Sadiku, Matthew N. O.
Publisher:
Oxford University Press

Mechanics of Materials (10th Edition)
Mechanical Engineering
ISBN:
9780134319650
Author:
Russell C. Hibbeler
Publisher:
PEARSON

Thermodynamics: An Engineering Approach
Mechanical Engineering
ISBN:
9781259822674
Author:
Yunus A. Cengel Dr., Michael A. Boles
Publisher:
McGraw-Hill Education
Elements Of Electromagnetics
Mechanical Engineering
ISBN:
9780190698614
Author:
Sadiku, Matthew N. O.
Publisher:
Oxford University Press
Mechanics of Materials (10th Edition)
Mechanical Engineering
ISBN:
9780134319650
Author:
Russell C. Hibbeler
Publisher:
PEARSON
Thermodynamics: An Engineering Approach
Mechanical Engineering
ISBN:
9781259822674
Author:
Yunus A. Cengel Dr., Michael A. Boles
Publisher:
McGraw-Hill Education

Control Systems Engineering
Mechanical Engineering
ISBN:
9781118170519
Author:
Norman S. Nise
Publisher:
WILEY

Mechanics of Materials (MindTap Course List)
Mechanical Engineering
ISBN:
9781337093347
Author:
Barry J. Goodno, James M. Gere
Publisher:
Cengage Learning

Engineering Mechanics: Statics
Mechanical Engineering
ISBN:
9781118807330
Author:
James L. Meriam, L. G. Kraige, J. N. Bolton
Publisher:
WILEY