Students in a learning theory study were given an exam and then retested monthly for 6 months with an equivalent exam. The data obtained in the study are shown in the cable, where t is the time in months after the initial exam and s is the average score for the students. 1 2 3 4 5 6 t 84.7 78.2 72.6 68.8 66.7 65.6 (a) Use a graphing utility to find a logarithmic model for the average score s in terms of the time t. (Round your coefficients to two decimal places.) s(t) = (b) Use a graphing utility to plot the data and graph the model. How well does the model fit the data? O The model fits the data well. O The model does not fit the data well. (c) Find the rates of change of s with respect to t when t = 3 and t = 5. (Round your answer to one decimal place.) t = 3 t = 5
Students in a learning theory study were given an exam and then retested monthly for 6 months with an equivalent exam. The data obtained in the study are shown in the cable, where t is the time in months after the initial exam and s is the average score for the students. 1 2 3 4 5 6 t 84.7 78.2 72.6 68.8 66.7 65.6 (a) Use a graphing utility to find a logarithmic model for the average score s in terms of the time t. (Round your coefficients to two decimal places.) s(t) = (b) Use a graphing utility to plot the data and graph the model. How well does the model fit the data? O The model fits the data well. O The model does not fit the data well. (c) Find the rates of change of s with respect to t when t = 3 and t = 5. (Round your answer to one decimal place.) t = 3 t = 5

Chapter6: Exponential And Logarithmic Functions
Section6.8: Fitting Exponential Models To Data
Problem 2TI: Sales of a video game released in the year 2000 took off at first, but then steadily slowed as time...

Related questions

Topic Video
Question
Please help me with this question.
Thank you!
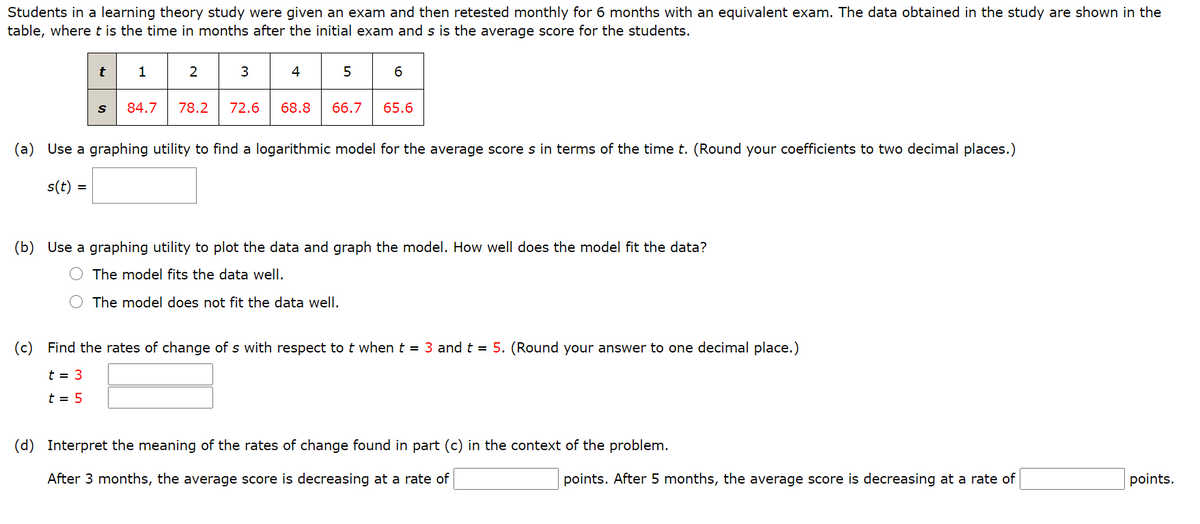
Transcribed Image Text:Students in a learning theory study were given an exam and then retested monthly for 6 months with an equivalent exam. The data obtained in the study are shown in the
table, wheret is the time in months after the initial exam and s is the average score for the students.
t
1
2
3
4
84.7
78.2
72.6
68.8
66.7
65.6
(a) Use a graphing utility to find a logarithmic model for the average score s in terms of the time t. (Round your coefficients to two decimal places.)
s(t) =
(b) Use a graphing utility to plot the data and graph the model. How well does the model fit the data?
The model fits the data well.
The model does not fit the data well.
(c) Find the rates of change of s with respect to t when t = 3 and t = 5. (Round your answer to one decimal place.)
t = 3
t = 5
(d) Interpret the meaning of the rates of change found in part (c) in the context of the problem.
After 3 months, the average score is decreasing at a rate of
points. After 5 months, the average score is decreasing at a rate of
points.
Expert Solution
This question has been solved!
Explore an expertly crafted, step-by-step solution for a thorough understanding of key concepts.

This is a popular solution!

Trending now
This is a popular solution!

Step by step
Solved in 4 steps with 1 images

Knowledge Booster


Learn more about
Need a deep-dive on the concept behind this application? Look no further. Learn more about this topic, calculus and related others by exploring similar questions and additional content below.Recommended textbooks for you

College Algebra (MindTap Course List)
Algebra
ISBN:
9781305652231
Author:
R. David Gustafson, Jeff Hughes
Publisher:
Cengage Learning

Algebra & Trigonometry with Analytic Geometry
Algebra
ISBN:
9781133382119
Author:
Swokowski
Publisher:
Cengage
College Algebra (MindTap Course List)
Algebra
ISBN:
9781305652231
Author:
R. David Gustafson, Jeff Hughes
Publisher:
Cengage Learning
Algebra & Trigonometry with Analytic Geometry
Algebra
ISBN:
9781133382119
Author:
Swokowski
Publisher:
Cengage