study to decide whether support groups improve (2) A researcher conducts a academic performance for at-risk high school students. Ten such students are ran- domly selected to take part in the support group for a semester, while the other 10 at-risk students serve as a control group. At the end of the semester, the improve- ment in GPA versus the previous semester is recorded for each student. Support Group: 0.5, 0.8, 0.7, 0.7, -0.1, 0.2, 0.4, 0.4, 0.5, 0.4 Control Group: -0.3, 0.0, -0.1, 0.2, -0.1, -0.2, -0.2, 0.0, -0.1, 0.1 (a) At the 5% level, test whether there is evidence of a difference in variance between the two groups. Assume normality for this test.You may use R for to conduct the test, but you need to write your hypotheses, the test statistic, the p-value, and the decision/conclusion in the context of the problem (b) At the 10% level, test whether there is evidence that the true mean GPA increase is higher for the students who were in the support group. Use the results of part a) to inform your decision of whether to pool (or not). You may use R for to conduct the test, but you need to write your hypotheses, the test statistic, the p-value, and the decision/conclusion in the context of the problem (c) At the 10% level, groups. You may use R for to conduct the test, but you need to write your hypotheses, the test statistic, the p-value, and the decision/conclusion in the context of the problem.Comment on how this test differs from the test in part b) use the Wilcoxon-Mann-Whitney test to compare the two End
study to decide whether support groups improve (2) A researcher conducts a academic performance for at-risk high school students. Ten such students are ran- domly selected to take part in the support group for a semester, while the other 10 at-risk students serve as a control group. At the end of the semester, the improve- ment in GPA versus the previous semester is recorded for each student. Support Group: 0.5, 0.8, 0.7, 0.7, -0.1, 0.2, 0.4, 0.4, 0.5, 0.4 Control Group: -0.3, 0.0, -0.1, 0.2, -0.1, -0.2, -0.2, 0.0, -0.1, 0.1 (a) At the 5% level, test whether there is evidence of a difference in variance between the two groups. Assume normality for this test.You may use R for to conduct the test, but you need to write your hypotheses, the test statistic, the p-value, and the decision/conclusion in the context of the problem (b) At the 10% level, test whether there is evidence that the true mean GPA increase is higher for the students who were in the support group. Use the results of part a) to inform your decision of whether to pool (or not). You may use R for to conduct the test, but you need to write your hypotheses, the test statistic, the p-value, and the decision/conclusion in the context of the problem (c) At the 10% level, groups. You may use R for to conduct the test, but you need to write your hypotheses, the test statistic, the p-value, and the decision/conclusion in the context of the problem.Comment on how this test differs from the test in part b) use the Wilcoxon-Mann-Whitney test to compare the two End

Functions and Change: A Modeling Approach to College Algebra (MindTap Course List)
6th Edition
ISBN:9781337111348
Author:Bruce Crauder, Benny Evans, Alan Noell
Publisher:Bruce Crauder, Benny Evans, Alan Noell
Chapter5: A Survey Of Other Common Functions
Section5.6: Higher-degree Polynomials And Rational Functions
Problem 5E: Population Genetics In the study of population genetics, an important measure of inbreeding is the...

Related questions
Topic Video
Question
Please, help solve this question with a friendly solution. Please, I need the R Codes as well. Take you very much!
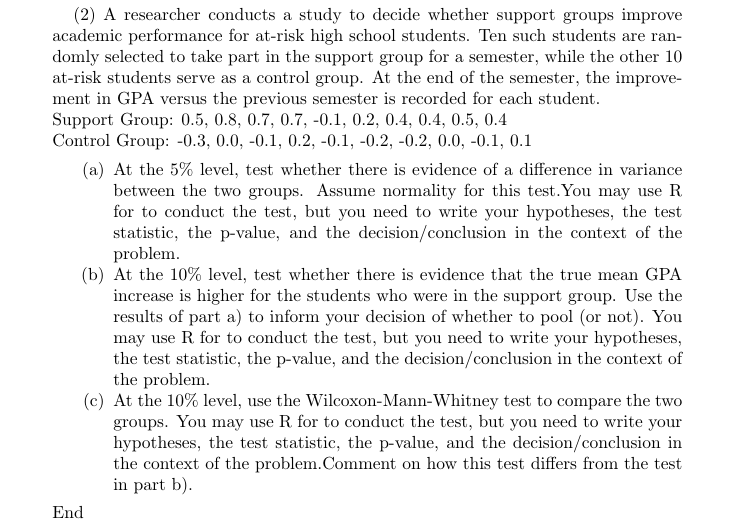
Transcribed Image Text:study to decide whether support groups improve
(2) A researcher conducts a
academic performance for at-risk high school students. Ten such students are ran-
domly selected to take part in the support group for a semester, while the other 10
at-risk students serve as a control group. At the end of the semester, the improve-
ment in GPA versus the previous semester is recorded for each student.
Support Group: 0.5, 0.8, 0.7, 0.7, -0.1, 0.2, 0.4, 0.4, 0.5, 0.4
Control Group: -0.3, 0.0, -0.1, 0.2, -0.1, -0.2, -0.2, 0.0, -0.1, 0.1
(a) At the 5% level, test whether there is evidence of a difference in variance
between the two groups. Assume normality for this test.You may use R
for to conduct the test, but you need to write your hypotheses, the test
statistic, the p-value, and the decision/conclusion in the context of the
problem
(b) At the 10% level, test whether there is evidence that the true mean GPA
increase is higher for the students who were in the support group. Use the
results of part a) to inform your decision of whether to pool (or not). You
may use R for to conduct the test, but you need to write your hypotheses,
the test statistic, the p-value, and the decision/conclusion in the context of
the problem
(c) At the 10% level,
groups. You may use R for to conduct the test, but you need to write your
hypotheses, the test statistic, the p-value, and the decision/conclusion in
the context of the problem.Comment on how this test differs from the test
in part b)
use the Wilcoxon-Mann-Whitney test to compare the two
End
Expert Solution
This question has been solved!
Explore an expertly crafted, step-by-step solution for a thorough understanding of key concepts.

This is a popular solution!

Trending now
This is a popular solution!

Step by step
Solved in 5 steps with 5 images

Knowledge Booster


Learn more about
Need a deep-dive on the concept behind this application? Look no further. Learn more about this topic, statistics and related others by exploring similar questions and additional content below.Recommended textbooks for you
Functions and Change: A Modeling Approach to Coll…
Algebra
ISBN:
9781337111348
Author:
Bruce Crauder, Benny Evans, Alan Noell
Publisher:
Cengage Learning

Holt Mcdougal Larson Pre-algebra: Student Edition…
Algebra
ISBN:
9780547587776
Author:
HOLT MCDOUGAL
Publisher:
HOLT MCDOUGAL

Big Ideas Math A Bridge To Success Algebra 1: Stu…
Algebra
ISBN:
9781680331141
Author:
HOUGHTON MIFFLIN HARCOURT
Publisher:
Houghton Mifflin Harcourt
Functions and Change: A Modeling Approach to Coll…
Algebra
ISBN:
9781337111348
Author:
Bruce Crauder, Benny Evans, Alan Noell
Publisher:
Cengage Learning
Holt Mcdougal Larson Pre-algebra: Student Edition…
Algebra
ISBN:
9780547587776
Author:
HOLT MCDOUGAL
Publisher:
HOLT MCDOUGAL
Big Ideas Math A Bridge To Success Algebra 1: Stu…
Algebra
ISBN:
9781680331141
Author:
HOUGHTON MIFFLIN HARCOURT
Publisher:
Houghton Mifflin Harcourt

College Algebra (MindTap Course List)
Algebra
ISBN:
9781305652231
Author:
R. David Gustafson, Jeff Hughes
Publisher:
Cengage Learning