Šuppose that a producer is faced with input combinations that yield 500 units. Assume that capital and labor cost PI,000 each and production budget is P4,000. Complete the table below and plot the isoquant curve and the isocost line in a graph. Determine the input combination that corresponds to the least cost. Table 7.3 Isoquant and Cost Table K Cost (K) Cost (L) Total Cost 1 4 4 1 58 Interpreting the Isoquant and Isocost Scamet with Caa Isocost line: K L 4
Šuppose that a producer is faced with input combinations that yield 500 units. Assume that capital and labor cost PI,000 each and production budget is P4,000. Complete the table below and plot the isoquant curve and the isocost line in a graph. Determine the input combination that corresponds to the least cost. Table 7.3 Isoquant and Cost Table K Cost (K) Cost (L) Total Cost 1 4 4 1 58 Interpreting the Isoquant and Isocost Scamet with Caa Isocost line: K L 4

Related questions
Question
100%
Please help me understand this with explanation and complete solutions thank you
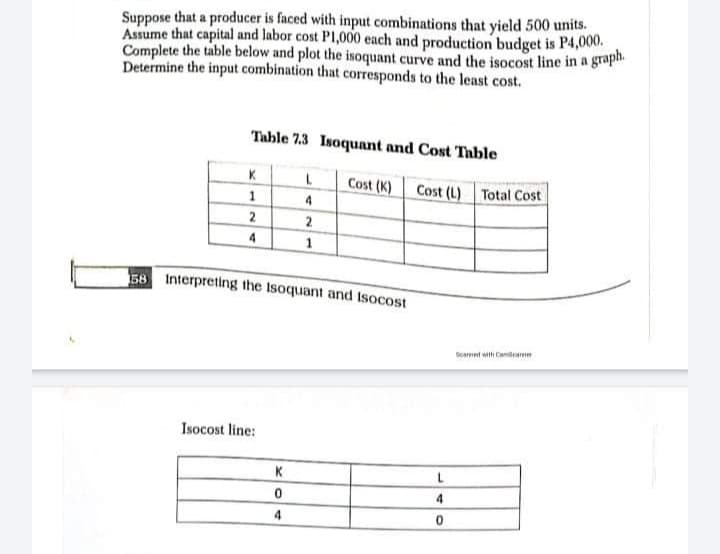
Transcribed Image Text:Suppose that a producer is faced with input combinations that yield 500 units.
Assume that capital and labor cost P1,000 each and production budget is P4,000.
Complete the table below and plot the isoquant curve and the isocost line in a graph.
Determine the input combination that corresponds to the least cost.
Table 7.3 Isoquant and Cost Table
K
Cost (K)
Cost (L) Total Cost
4
4
58 Interpreting the Isoquant and Isocost
Seamet with Camam
Isocost line:
K
L.
4
Expert Solution
This question has been solved!
Explore an expertly crafted, step-by-step solution for a thorough understanding of key concepts.

Step by step
Solved in 2 steps with 1 images

Knowledge Booster


Learn more about
Need a deep-dive on the concept behind this application? Look no further. Learn more about this topic, economics and related others by exploring similar questions and additional content below.