Suppose you analyzed the average monthly credit card bill of Visa credit card customers using two randomly selected samples: one with 144 Visa credit card customers (Sample #1) and one with 100 Visa credit card customers (Sample #2). Every credit card customer in Sample #1 had a monthly credit card bill of $1,812. Sample #2, on the other hand, had an average monthly credit card bill of $1,868 with a variance of 1,302,388 (SM2. If you combined these samples into one... Question 2 What would be the combined monthly credit card bill average (in dollars)? Question 3A What is the combined monthly credit card bill median (in dollars)? Question 3BWha is the shape of the combined monthly credit card bill distribution (in dollars)? Question 4 What would be the combined monthly credit card bill standard deviation (in dollars)?
Suppose you analyzed the average monthly credit card bill of Visa credit card customers using two randomly selected samples: one with 144 Visa credit card customers (Sample #1) and one with 100 Visa credit card customers (Sample #2). Every credit card customer in Sample #1 had a monthly credit card bill of $1,812. Sample #2, on the other hand, had an average monthly credit card bill of $1,868 with a variance of 1,302,388 (SM2. If you combined these samples into one... Question 2 What would be the combined monthly credit card bill average (in dollars)? Question 3A What is the combined monthly credit card bill median (in dollars)? Question 3BWha is the shape of the combined monthly credit card bill distribution (in dollars)? Question 4 What would be the combined monthly credit card bill standard deviation (in dollars)?

Glencoe Algebra 1, Student Edition, 9780079039897, 0079039898, 2018
18th Edition
ISBN:9780079039897
Author:Carter
Publisher:Carter
Chapter4: Equations Of Linear Functions
Section: Chapter Questions
Problem 8SGR

Related questions
Question
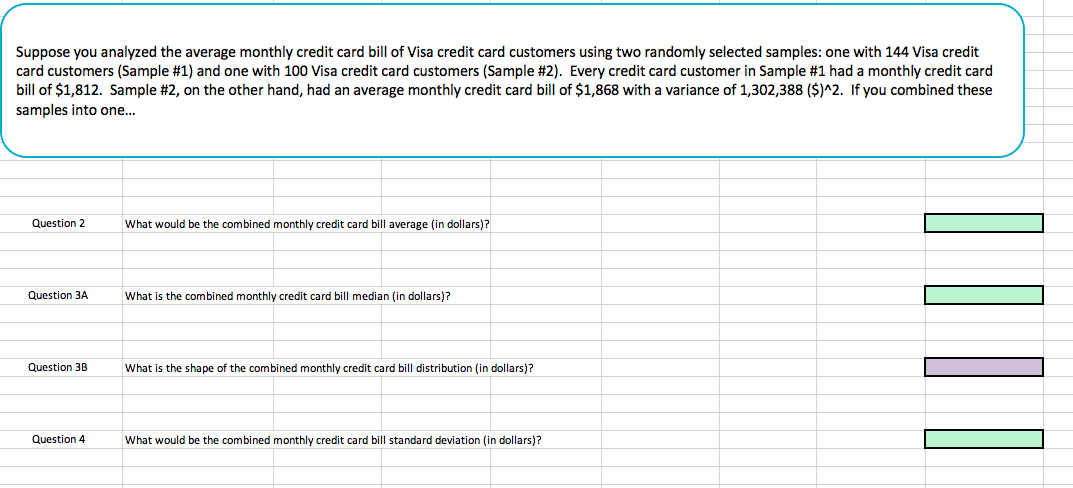
Transcribed Image Text:Suppose you analyzed the average monthly credit card bill of Visa credit card customers using two randomly selected samples: one with 144 Visa credit
card customers (Sample #1) and one with 100 Visa credit card customers (Sample #2). Every credit card customer in Sample #1 had a monthly credit card
bill of $1,812. Sample #2, on the other hand, had an average monthly credit card bill of $1,868 with a variance of 1,302,388 (SM2. If you combined these
samples into one...
Question 2
What would be the combined monthly credit card bill average (in dollars)?
Question 3A
What is the combined monthly credit card bill median (in dollars)?
Question 3BWha is the shape of the combined monthly credit card bill distribution (in dollars)?
Question 4
What would be the combined monthly credit card bill standard deviation (in dollars)?
Expert Solution
This question has been solved!
Explore an expertly crafted, step-by-step solution for a thorough understanding of key concepts.

This is a popular solution!

Trending now
This is a popular solution!

Step by step
Solved in 7 steps with 5 images

Recommended textbooks for you
Glencoe Algebra 1, Student Edition, 9780079039897…
Algebra
ISBN:
9780079039897
Author:
Carter
Publisher:
McGraw Hill

College Algebra (MindTap Course List)
Algebra
ISBN:
9781305652231
Author:
R. David Gustafson, Jeff Hughes
Publisher:
Cengage Learning
Glencoe Algebra 1, Student Edition, 9780079039897…
Algebra
ISBN:
9780079039897
Author:
Carter
Publisher:
McGraw Hill
College Algebra (MindTap Course List)
Algebra
ISBN:
9781305652231
Author:
R. David Gustafson, Jeff Hughes
Publisher:
Cengage Learning