Suppose you have been hired as a management consultant by a major oil company to help it optimally price gasoline at its service stations. Your research has uncovered the following data: Price of Crude Oil $ 80 90 100 110 GDP 17.0 16.9 16.8 16.7 #of New Mustaches Grown Price of Gasoline $2.75 3.00 3.25 3.50 3,000 2,000 5,000 1,000 Your client has asked you to plot GDP and gasoline prices on a graph. 1.) Using the multipoint curve drawing tool, plot GDP against gasoline prices on the graph to the right. Carefully follow the instructions above and only draw the required object. Click to enlarge graph Gasoline Prices per Galon) 3.75 3.50 3.25 3.00 2.75 2.50 16.5 16.9 GOP 16.7 17.1 After plotting the final point of your multipoint curve, press the Esc key on your keyboard to end the line.
Suppose you have been hired as a management consultant by a major oil company to help it optimally price gasoline at its service stations. Your research has uncovered the following data: Price of Crude Oil $ 80 90 100 110 GDP 17.0 16.9 16.8 16.7 #of New Mustaches Grown Price of Gasoline $2.75 3.00 3.25 3.50 3,000 2,000 5,000 1,000 Your client has asked you to plot GDP and gasoline prices on a graph. 1.) Using the multipoint curve drawing tool, plot GDP against gasoline prices on the graph to the right. Carefully follow the instructions above and only draw the required object. Click to enlarge graph Gasoline Prices per Galon) 3.75 3.50 3.25 3.00 2.75 2.50 16.5 16.9 GOP 16.7 17.1 After plotting the final point of your multipoint curve, press the Esc key on your keyboard to end the line.

Chapter6: Demand Relationships Among Goods
Section: Chapter Questions
Problem 6.8P

Related questions
Question
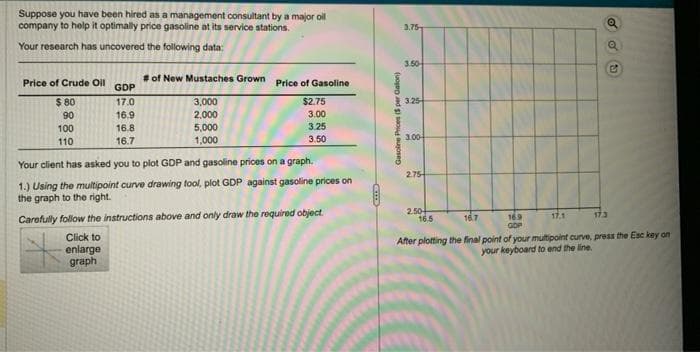
Transcribed Image Text:Suppose you have been hired as a management consultant by a major oil
company to help it optimally price gasoline at its service stations.
Your research has uncovered the following data:
Price of Crude Oil
$ 80
90
100
110
GDP
17.0
16.9
16.8
16.7
#of New Mustaches Grown Price of Gasoline
$2.75
3.00
3.25
3.50
3,000
2,000
5,000
1,000
Your client has asked you to plot GDP and gasoline prices on a graph.
1.) Using the multipoint curve drawing tool, plot GDP against gasoline prices on
the graph to the right.
Carefully follow the instructions above and only draw the required object.
Click to
enlarge
graph
Came
Gasoline Prices ($per Galon)
3.75
3.50-
3.25
3.00-
2.75
2.50+
16,5
16.9
GOP
Q
16.7
17.1
17.3
After plotting the final point of your multipoint curve, press the Esc key on
your keyboard to end the line.
Expert Solution
This question has been solved!
Explore an expertly crafted, step-by-step solution for a thorough understanding of key concepts.

This is a popular solution!

Trending now
This is a popular solution!

Step by step
Solved in 2 steps with 1 images

Knowledge Booster


Learn more about
Need a deep-dive on the concept behind this application? Look no further. Learn more about this topic, economics and related others by exploring similar questions and additional content below.Recommended textbooks for you


Principles of Microeconomics
Economics
ISBN:
9781305156050
Author:
N. Gregory Mankiw
Publisher:
Cengage Learning