Suppose you surveyed 30 people and asked them whether they are white (W) or nonwhite (N) and how many traumas (serious accidents, rapes, or crimes) they have experienced in the past year. You also asked them to tell you whether they perceive themselves as being in the upper, middle, working, or lower class. Your survey resultec the raw data presented in the following table: a. Identify the level of measurement for each variable,
Suppose you surveyed 30 people and asked them whether they are white (W) or nonwhite (N) and how many traumas (serious accidents, rapes, or crimes) they have experienced in the past year. You also asked them to tell you whether they perceive themselves as being in the upper, middle, working, or lower class. Your survey resultec the raw data presented in the following table: a. Identify the level of measurement for each variable,

Glencoe Algebra 1, Student Edition, 9780079039897, 0079039898, 2018
18th Edition
ISBN:9780079039897
Author:Carter
Publisher:Carter
Chapter10: Statistics
Section10.6: Summarizing Categorical Data
Problem 42PFA

Related questions
Question
100%
Transcribed Image Text:CHAPTER EXERCISES
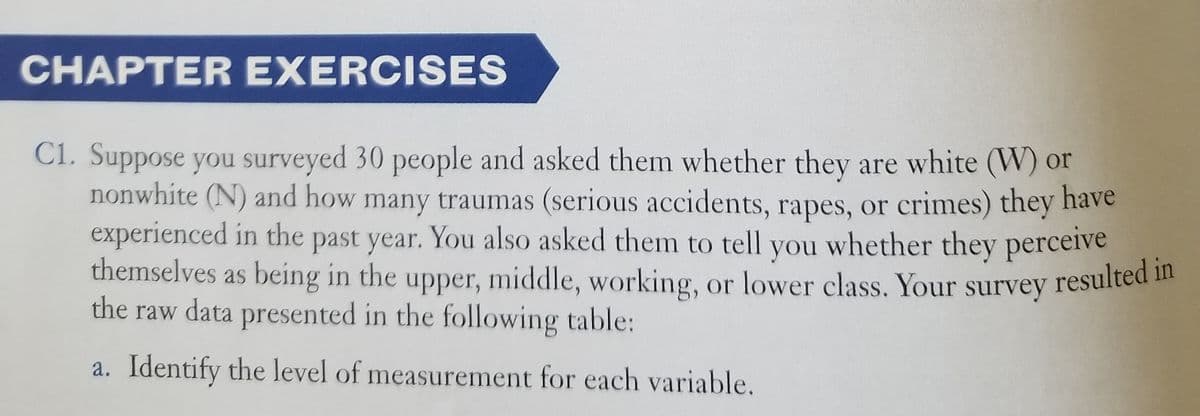
C1. Suppose you surveyed 30 people and asked them whether they are white (W) or
nonwhite (N) and how many traumas (serious accidents, rapes, or crimes) they have
experienced in the past year. You also asked them to tell you whether they perceive
themselves as being in the upper, middle, working, or lower class. Your survey resulted il
the raw data presented in the following table:
a. Identify the level of measurement for each variable.
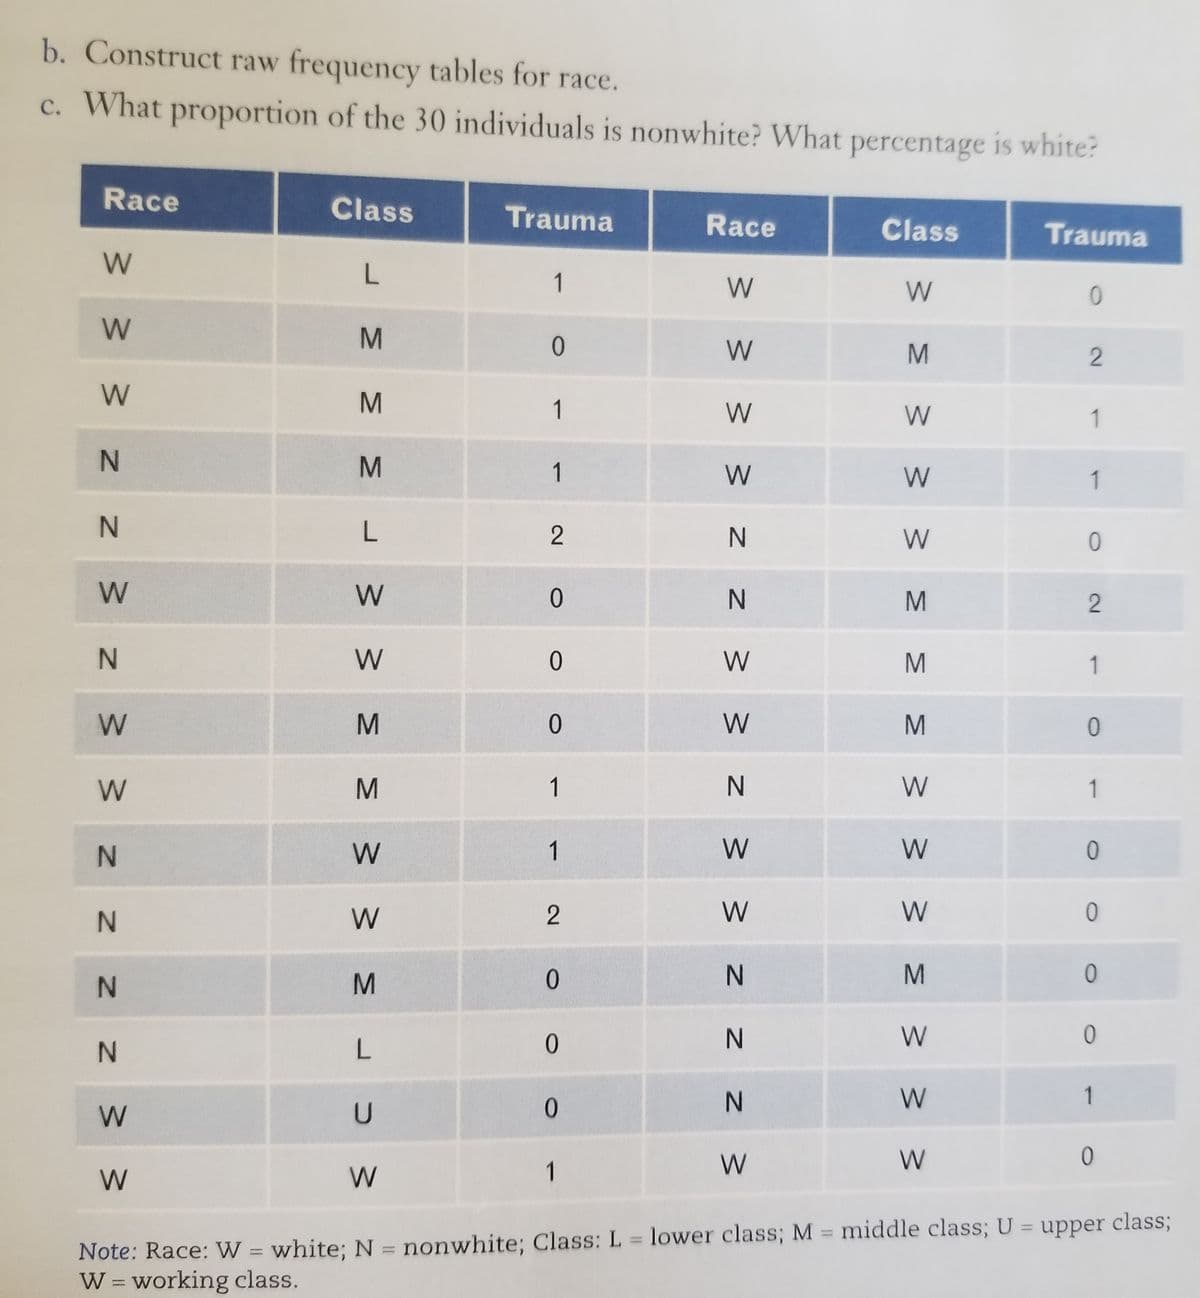
Transcribed Image Text:b. Construct raw frequency tables for race.
c. What proportion of the 30 individuals is nonwhite? What percentage is white?
Race
Class
Trauma
Race
Class
Trauma
1
W
M
1
W
W
1
1
W
1
L
2
W
N.
W
W
M
1
M
W
M
M.
1
W
1
N.
1
W
W
W
W
W
N.
M
W
N.
L
N.
W
1
1
W
W
Note: Race: W = white; N = nonwhite; Class: L = lower class; M middle class; U = upper class;
W = working class.
%3D
%3D
%3D
2.
MN
MN
Expert Solution
This question has been solved!
Explore an expertly crafted, step-by-step solution for a thorough understanding of key concepts.

This is a popular solution!

Trending now
This is a popular solution!

Step by step
Solved in 2 steps

Recommended textbooks for you
Glencoe Algebra 1, Student Edition, 9780079039897…
Algebra
ISBN:
9780079039897
Author:
Carter
Publisher:
McGraw Hill

Big Ideas Math A Bridge To Success Algebra 1: Stu…
Algebra
ISBN:
9781680331141
Author:
HOUGHTON MIFFLIN HARCOURT
Publisher:
Houghton Mifflin Harcourt
Glencoe Algebra 1, Student Edition, 9780079039897…
Algebra
ISBN:
9780079039897
Author:
Carter
Publisher:
McGraw Hill
Big Ideas Math A Bridge To Success Algebra 1: Stu…
Algebra
ISBN:
9781680331141
Author:
HOUGHTON MIFFLIN HARCOURT
Publisher:
Houghton Mifflin Harcourt