Suppose you wish to determine if the mean IQ of students on a certain campus is different from the mean IQ in the general population, 100. To conduct this study, you obtain a simple random sample of 60 students on this campus, administer an IQ test, and record the results. The mean IQ of the sample of 60 students is found to be 107.2 with a standard deviation of 11.8. Complete parts (a) through (c) below. Click the icon to view the t-distribution table. (a) Construct a hypothesis test Hg: u= Ho versus H,: µ# Ho for Ho = 103, 104, 105, 106, 107, 108, 109, 110, 111, and 112 at a= 0.05 level of significance. Determine the test statistics for Ho = 103, 104, 105, 106, and 107. Ho = 103 to = Ho = 104 to = Ho = 105 Ho = 106 Ho = 107 tn = (Round to two decimal places as needed.) Determine the test statistics for Ho = 108, 109, 110, 111, and 112. Ho = 108 to =0 to =U to =0 Ho = 109 Ho = 110 Ho = 111 Ho = 112 (Round to two decimal places as needed.) Determine the critical value(s) for the Ho: H= Ho versus H,:H# Ho hypothesis test with sample size 60 and a = 0.05 level of significance. Select the correct choice below and fill in the answer box(es) within your choice. (Round to three decimal places as needed.) A. The critical values are t B. The critical value is For which given values of H, is the null hypothesis, u=H0, not rejected? (Type whole numbers.) O A. Hos В. SHo S C. Ho 2 D. Hos or Ho 2 Click to select your answer(s).
Suppose you wish to determine if the mean IQ of students on a certain campus is different from the mean IQ in the general population, 100. To conduct this study, you obtain a simple random sample of 60 students on this campus, administer an IQ test, and record the results. The mean IQ of the sample of 60 students is found to be 107.2 with a standard deviation of 11.8. Complete parts (a) through (c) below. Click the icon to view the t-distribution table. (a) Construct a hypothesis test Hg: u= Ho versus H,: µ# Ho for Ho = 103, 104, 105, 106, 107, 108, 109, 110, 111, and 112 at a= 0.05 level of significance. Determine the test statistics for Ho = 103, 104, 105, 106, and 107. Ho = 103 to = Ho = 104 to = Ho = 105 Ho = 106 Ho = 107 tn = (Round to two decimal places as needed.) Determine the test statistics for Ho = 108, 109, 110, 111, and 112. Ho = 108 to =0 to =U to =0 Ho = 109 Ho = 110 Ho = 111 Ho = 112 (Round to two decimal places as needed.) Determine the critical value(s) for the Ho: H= Ho versus H,:H# Ho hypothesis test with sample size 60 and a = 0.05 level of significance. Select the correct choice below and fill in the answer box(es) within your choice. (Round to three decimal places as needed.) A. The critical values are t B. The critical value is For which given values of H, is the null hypothesis, u=H0, not rejected? (Type whole numbers.) O A. Hos В. SHo S C. Ho 2 D. Hos or Ho 2 Click to select your answer(s).

Glencoe Algebra 1, Student Edition, 9780079039897, 0079039898, 2018
18th Edition
ISBN:9780079039897
Author:Carter
Publisher:Carter
Chapter10: Statistics
Section10.4: Distributions Of Data
Problem 19PFA

Related questions
Question
Q2
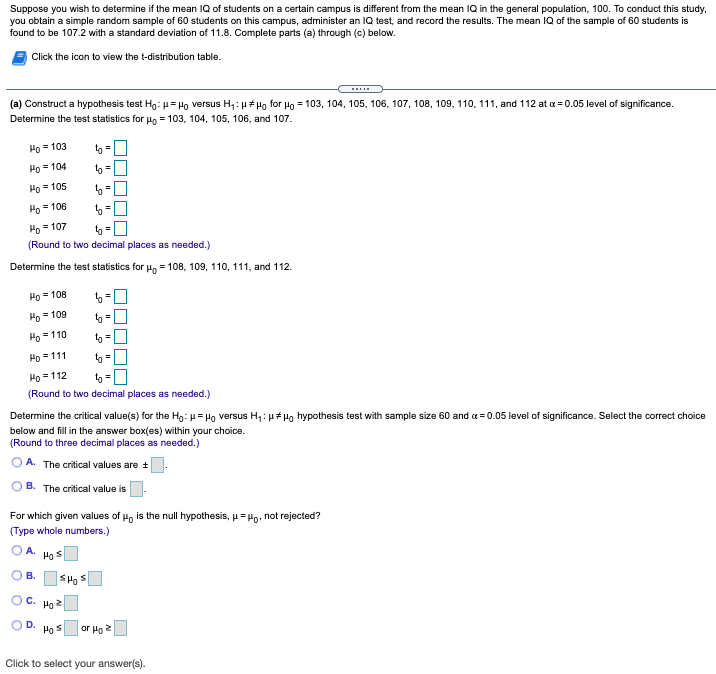
Transcribed Image Text:Suppose you wish to determine if the mean IQ of students on a certain campus is different from the mean IQ in the general population, 100. To conduct this study,
you obtain a simple random sample of 60 students on this campus, administer an IQ test, and record the results. The mean IQ of the sample of 60 students is
found to be 107.2 with a standard deviation of 11.8. Complete parts (a) through (c) below.
Click the icon to view the t-distribution table.
(a) Construct a hypothesis test Hg: u= Ho versus H,: µ# Ho for Ho = 103, 104, 105, 106, 107, 108, 109, 110, 111, and 112 at a= 0.05 level of significance.
Determine the test statistics for Ho = 103, 104, 105, 106, and 107.
Ho = 103
to =
Ho = 104
to =
Ho = 105
Ho = 106
Ho = 107
tn =
(Round to two decimal places as needed.)
Determine the test statistics for Ho = 108, 109, 110, 111, and 112.
Ho = 108
Ho = 109
to =0
Ho = 110
tn =
Ho = 111
to =0
Ho = 112
(Round to two decimal places as needed.)
Determine the critical value(s) for the Ho: H= Ho versus H,:H# Ho hypothesis test with sample size 60 and a = 0.05 level of significance. Select the correct choice
below and fill in the answer box(es) within your choice.
(Round to three decimal places as needed.)
A. The critical values are +
B. The critical value is
For which given values of 4, is the null hypothesis, p=Ho, not rejected?
(Type whole numbers.)
O A.
Hos
В.
SHo S
C.
Ho2
D.
Hos
or Ho 2
Click to select your answer(s).
Expert Solution
This question has been solved!
Explore an expertly crafted, step-by-step solution for a thorough understanding of key concepts.

This is a popular solution!

Trending now
This is a popular solution!

Step by step
Solved in 4 steps with 4 images

Knowledge Booster


Learn more about
Need a deep-dive on the concept behind this application? Look no further. Learn more about this topic, statistics and related others by exploring similar questions and additional content below.Recommended textbooks for you
Glencoe Algebra 1, Student Edition, 9780079039897…
Algebra
ISBN:
9780079039897
Author:
Carter
Publisher:
McGraw Hill
Glencoe Algebra 1, Student Edition, 9780079039897…
Algebra
ISBN:
9780079039897
Author:
Carter
Publisher:
McGraw Hill